
- Moose - Dec 26 (Click Here)
- Mountain Goat - Dec 31 (Click Here)
- Desert Bighorn - Jan 5 (Click Here)
- Rocky Mountain Bighorn - Today
- Bison - Jan 15
- Pronghorn - Jan 20
- Deer - Jan 25
- Elk - Jan 30
Subscribe below to stay up to date on each of these analyses and please enjoy as you research for your 2020 Utah Big Game application!
Value of a Point

For non-residents the value of a point is significantly less at 0.003% per bonus point. Follow the same formula to determine your average odds for non-residents take the number of bonus you have and add 1, then multiply by 0.003... so if I had 9 points my average odds would be (9+1)*0.003 = 0.030%.
If you really want to be sick... it would take 21 bonus points for a non-resident to have equivalent value to one single bonus point for a Utah resident. Sadly, several years ago when non-residents were permitted to apply for all once-in-a-lifetime species instead of selecting one like residents are required to do the non-resident bonus point was greatly de-valued.
Applicant Pool Evaluation
Let’s get a feel for the overall applicant pool for rocky mountain bighorn sheep using the two images below. The first image is shows the resident data, and the second image shows the non-resident data. The orange bars are the number of applicants who submitted an application for a specific hunt unit while the blue bars show the number of applicants who submitted an application to purchase the bonus point corresponding to the y-axis on the left. The gray line indicates the number of applicants who applied for a hunt unit corresponding to the second Y-axis on the right.
In the 2019 application there were more than 800 new applicants for rocky mountain bighorn sheep. The applicant pool for rocky mountain bighorn appears to be growing rapidly with an odd spike in applicants in the 2 point pools, a slight decline in 1 point applicants, but then a big bump in 0 point applicants. The number of applicants who just bought the point doesn't appear to have the same dramatic bump in the 2 point pool and decrease in 1 point pool... looking a the trend on the graph the number of people that buy points appears to be pretty steady. The 11 point group appears to be the peak in regards to the largest amount of random numbers issued but there doesn't appear to be a steep decline until the 17 point group, this tells me that the rocky mountain bighorn bonus point pool is top heavy with lots of applicants that have very high numbers of bonus points.
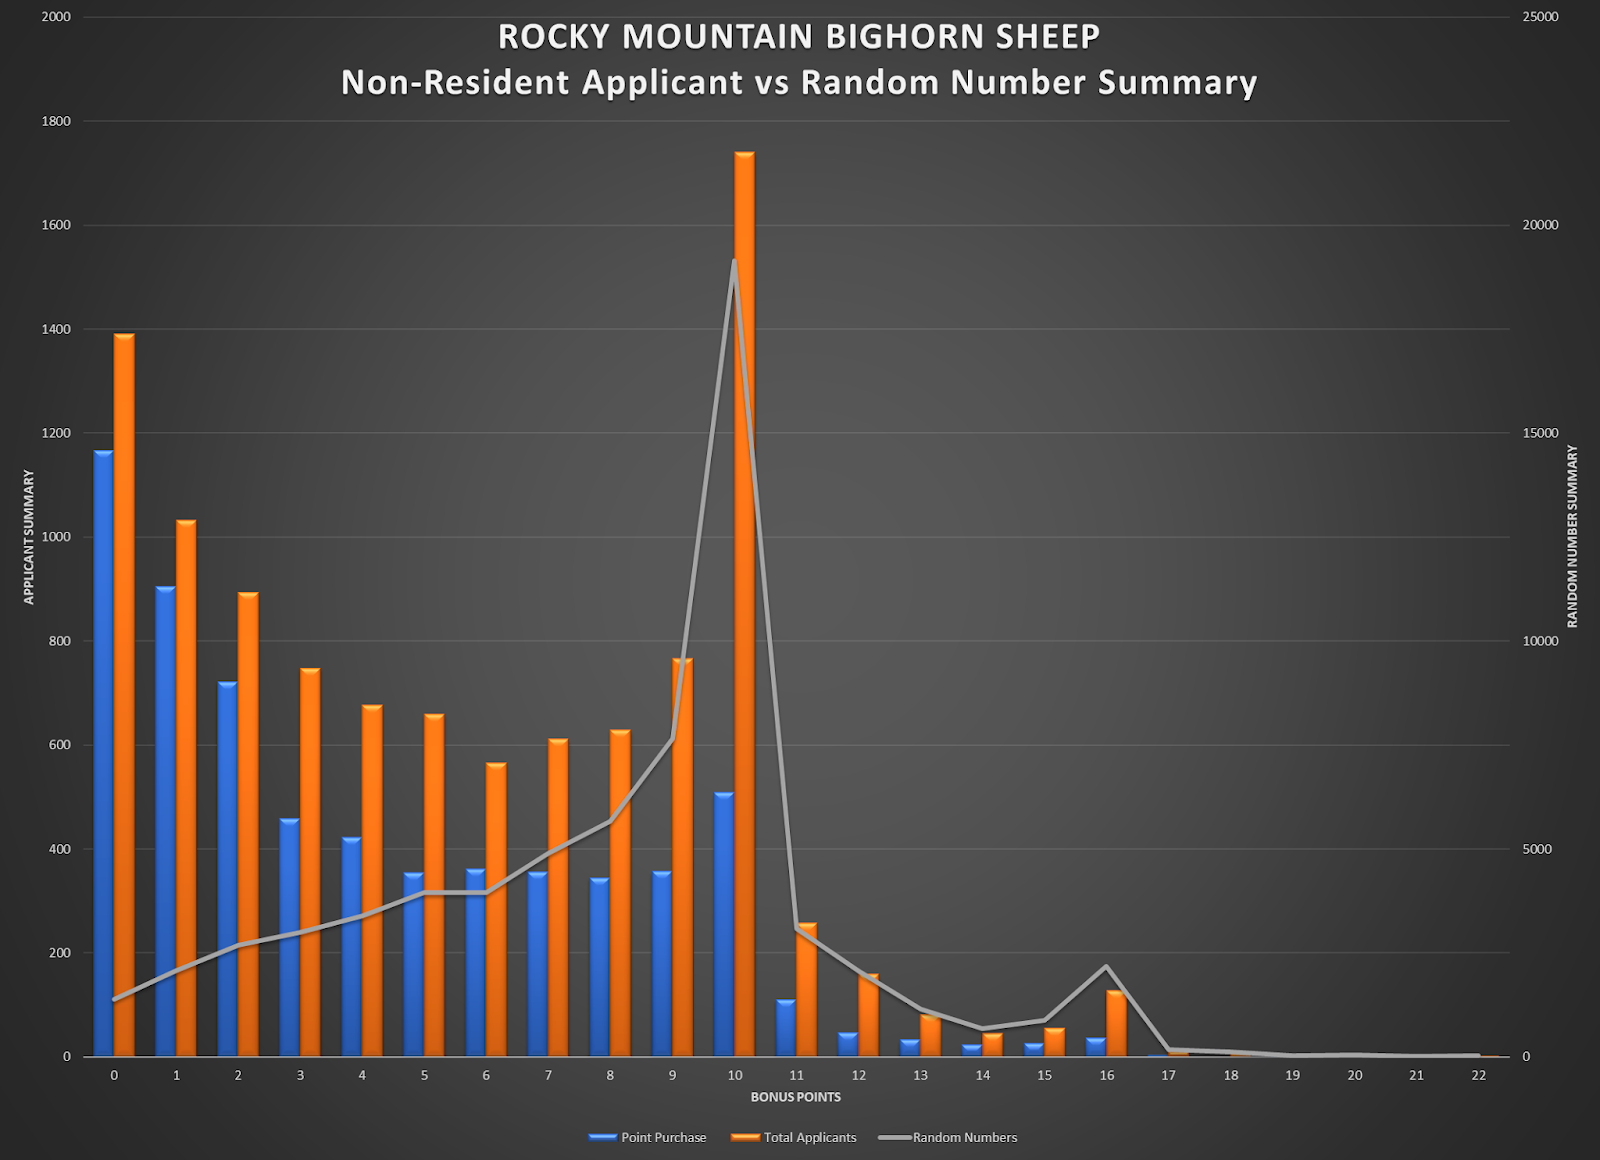
The non-resident pool is interesting... I see a trend and the growth appears to match an exponential growth curve. If you look at the graph and ignore the bars in the 7 through 10 bonus point pools the number of applicants appears to be quite steady. The outliers in the 7 through 10 bonus point pools coincide with the change allowing non-residents to apply for all once-in-a-lifetime species. Then there's that bizarre little spike in the 16 point group, I can't really attribute that to any one thing and it's weird to me.
Very quickly here, let's have a quick look at the percentage of applicants that apply for a hunt unit versus the percentage that purchase the point.


Notice that there is a trend for the top point holders having a higher tendency to purchase a preference point rather than apply for a hunt unit for residents. Five of the seven applicants with 23 or more bonus points did not actually apply for a hunt rather they purchased bonus points instead. This certainly will impact the "point creep" within the rocky mountain bighorn applicant pool as these 5 point buyers eventually decide to burn their points on an actual hunt. The non-resident applicant pool does not appear to follow the same trend to the same extent and the vast majority of applicants apply for specific units. But, since no bonus points are issued (no unit offers more than 1 tag) there is currently no appreciable benefit in purchasing a point rather applying for a unit... at least until the rocky mountain bighorn population is such that enough tags are offered to non-residents that having the highest number of bonus points is beneficial. If I was a non-resident, I would be applying for a unit rather than purchasing a point every single year.
Here is a look at the average number of bonus points over the last 5 years that it took to draw a Bonus Tag. I’ve included the PROJECTED 2020 average bonus points:

Tag Distribution
Here is a look at how the tags were distributed in 2019... The blue line shows the number of applicants and corresponds to the first Y-axis on the left. The orange bars are the regular tags drawn and the gray bars are the bonus tags issued to the highest point holders and correspond to the second second Y-axis on the right.


