Jan 30, 2020

Drawing Analysis: Limited Entry Elk

Utah's bucks, bulls, and once-in-a-lifetime application is here! This will be the final installment of this Drawing Analysis series, hopefully you find the information provided to be useful as you make your selections. If you missed any of the previous analyses you can find the individual species analysis linked below or you can find the same information on the Drawing Analysis page:
- Moose
- Mountain Goat
- Desert Bighorn
- Rocky Mountain Bighorn
- Bison
- Pronghorn
- Deer
- Elk - See Below

Subscribe to receive updates from The Glassing Tree, enter your email address:


Delivered by FeedBurner

In 2014 my grandfather drew a Central Mountains, Manti early rifle tag. It was a summer filled with excitement and expectations as we prepared for the hunt. Ultimately it didn't end up how we had anticipated and was honestly a rather frustrating string of events but it was not without a couple of close encounters that we should have capitalized on. Gramps hunt is chronicled on the Hunt Stories page. I'm currently sitting on enough points to be in very good shape to draw the hunt that I have been targeting since that hunt with my grandpa in 2014. 2020 should be the year for me to draw my first limited entry tag.

Value of a Point
Each point that you accumulate has a value in that it increases your odds of drawing a tag by a certain percentage. That percentage varies depending upon the species, the unit, and even varies from year to year. For residents, you can expect each bonus point that you have to increase your odds by about 0.407%. That means that with 0 points your average odds are 0.407%, with 1 point your average odds are 0.814%... basically take the number of bonus points you have and add 1, then multiply by 0.407. So if I have 9 points my average odds would be (9+1)*0.407 = 4.07%.
For non-residents the value of a point is about 0.108% per bonus point. Follow the same formula to determine your average odds for non-residents take the number of bonus you have and add 1, then multiply by 0.108.. so if I had 9 points my average odds would be (9+1)*0.108 = 1.08%.

Applicant Pool Evaluation
Let’s get a feel for the overall applicant pool for elk using the two images below. The first image is shows the resident data, and the second image shows the non-resident data. The orange bars are the number of applicants who submitted an application for a specific hunt unit while the blue bars show the number of applicants who submitted an application to purchase the bonus point, both sets of bars correspond to the y-axis on the left. The gray line indicates the number of random numbers received by applicants who applied for a hunt unit corresponding to the second Y-axis on the right.

The elk applicant pool is by far the largest of all limited entry or once-in-a-lifetime applicant pools with 7700 plus new applicants last year. The applicant pool for elk follows a smooth exponential curve with two blips occurring in the 1 and 2 point pools where growth in those two years seems to be slightly higher than the trend. Notice that the ratio of actual applicants compared to those who just buy the point is high for elk just like it was with the deer and pronghorn applicant pools... if an applicant is applying for any of the limited entry species they are in it to actually draw a tag rather than bank a point. Looking at the number of random numbers issued you can see just that the number of random numbers peaks at 5 points but declines slowly until the 14 point pool, after the 14 point pool the number of random numbers declines more rapidly.


The non-resident pool for elk was dramatically impacted by the change about 10 years ago that allowed non-residents to apply for all limited entry and once-in-a-lifetime species. The number of applicants has increased dramatically since and has remained much higher than before. The most interesting part of this graph is that in all point pools it is about 50-50 split between applicants who apply for a unit versus applicants who buy points. The data that I have presented tells me that non-resident applicants are looking to hunt elk in Utah, other species applied for are inexpensive add-ons to the elk application.

Very quickly here, let's have a quick look at the percentage of applicants that apply for a hunt unit versus the percentage that purchase the point.

The trend for residents is to apply for an actual hunt unit rather than purchase a point, it is pretty consistent throughout with between 70% and 80% of the applicant pool applying for a hunt unit. Only the top point groups show a higher prevalence of point buyers than actual applicants. For those with very high point totals and targeting the top tier units in the state, these point buyers need to be considered as they will eventually apply for a unit and impact those with point totals below them. The non-resident applicant pool the percentage of actual applicants is between 50% and 60% except for at the highest point pool where there is a tendency to buy a point rather than apply for a hunt.

Here is a look at the average number of bonus points over the last 5 years that it took to draw a Bonus Tag. I’ve included the PROJECTED 2020 average bonus points:

The limited entry elk pool is where applicants can really save themselves several years of applying unsuccessfully by choosing archery, muzzleloader, or a later rifle season. I call this "year savings." For residents, multi-season tags are a premium tag and bonus tags are projected to draw with almost 21 points. Early rifle tags are the most popular option for limited entry elk and are projected to draw with an average of just above 17 points, because of the popularity of the early rifle tags I will use that as the benchmark for comparison. Archery tags are projected to draw at about 8 points, so on average you could project to draw an archery tag 9 years before drawing the early rifle tag in a unit. Muzzleloader, middle rifle, and late rifle tags are projected to draw at about 13 points. So you could anticipate drawing any of these tags 4 years before drawing an early rifle tag for the same unit. If you are an archery hunter, your odds of drawing a tag are much higher, and your odds of drawing multiple tags over the course of a couple decades is considerably higher than a rifle hunter applying for an early rifle tag.
For non-residents, although not as dramatic, there is still a "year savings" to be had if you choose to select a more primitive weapon or a later rifle season. Archery projects to save 5 years. Muzzleloader, middle, and late rifle hunts project to save a couple years.
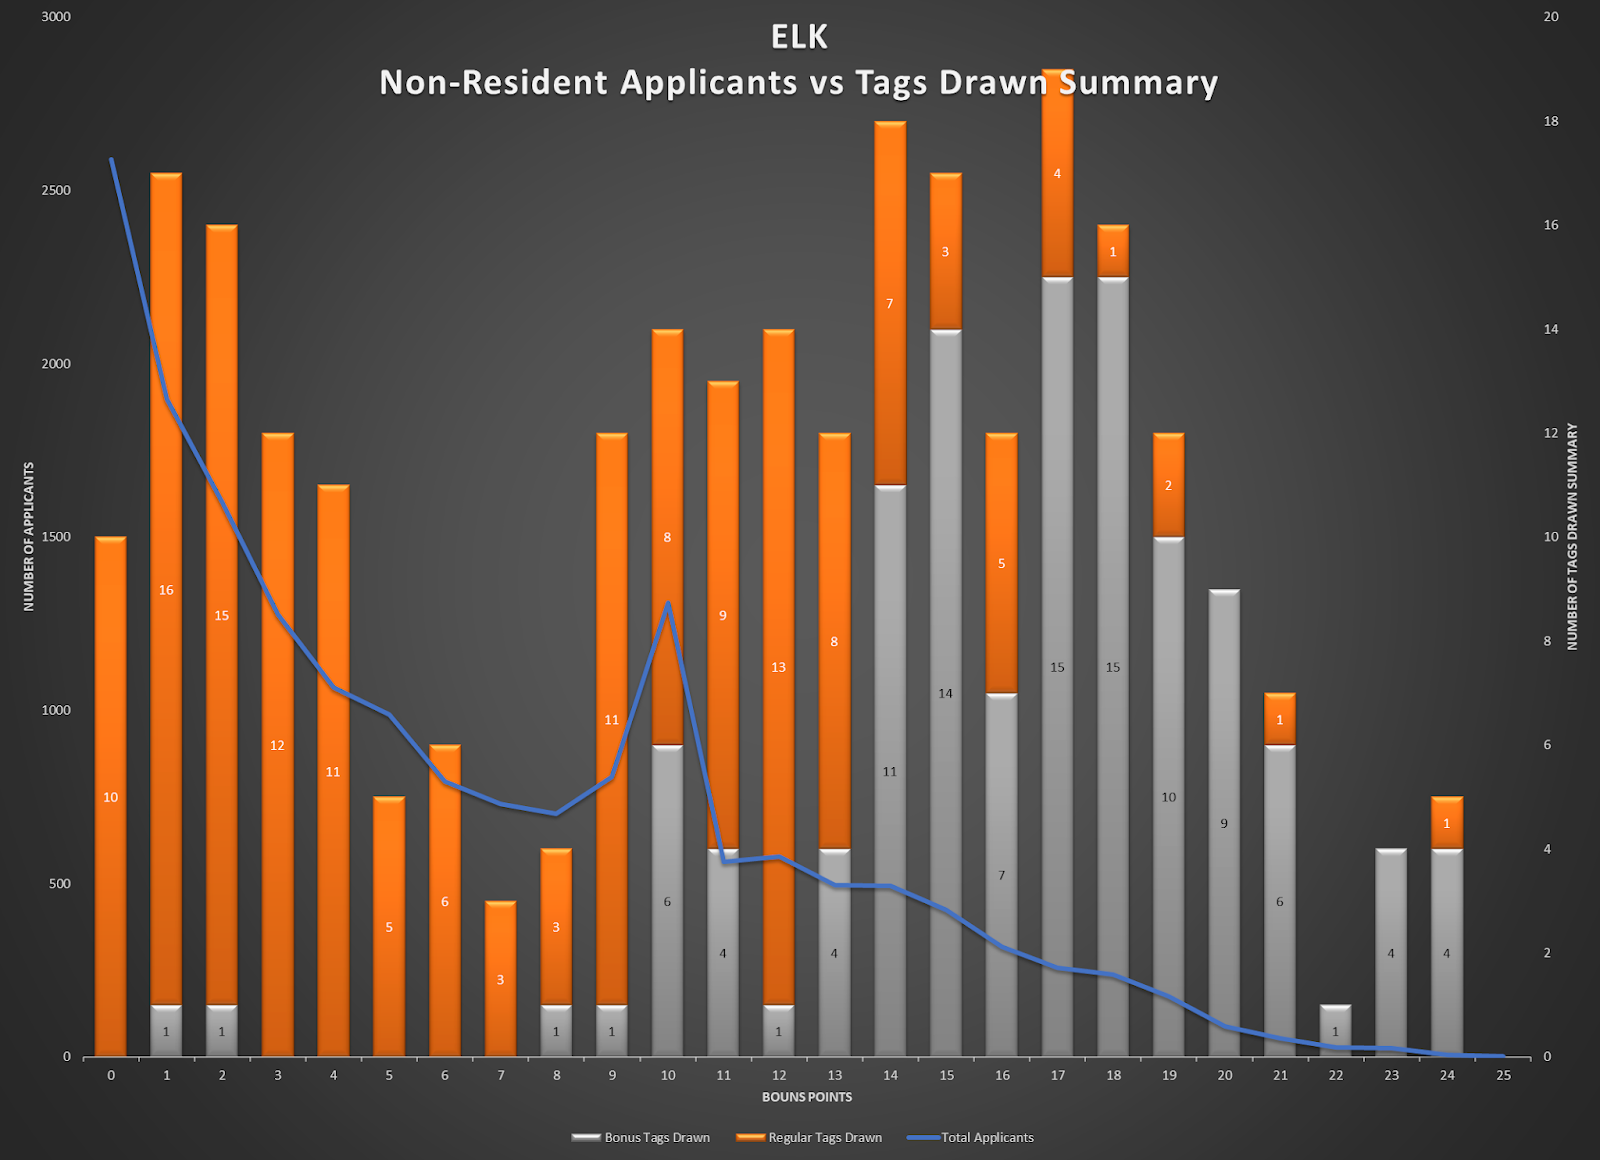
Tag Distribution
Here is a look at how the tags were distributed in 2019...
The blue line shows the number of applicants and corresponds to the first Y-axis on the left. The orange bars are the regular tags drawn and the gray bars are the bonus tags issued to the highest point holders and correspond to the second second Y-axis on the right.


Pictures

Jan 25, 2020

Drawing Analysis: Limited Entry Deer

In preparation for the Utah Big Game application period opening Jan 30th this year I will be releasing a species by species analysis of drawing odds. Here is the schedule I will follow:
- Moose - Dec 26 (Click Here)
- Mountain Goat - Dec 31 (Click Here)
- Desert Bighorn - Jan 5 (Click Here)
- Rocky Mountain Bighorn - Jan 10 (Click Here)
- Bison - Jan 15 (Click Here)
- Pronghorn - Jan 20 (Click Here)
- Deer - Today
- Elk - Jan 30

Subscribe below to stay up to date on each of these analyses and please enjoy as you research for your 2020 Utah Big Game application!

Subscribe to receive updates from The Glassing Tree, enter your email address:


Delivered by FeedBurner

I've had the opportunity to take part in two limited entry deer hunts. In both instances my friend Cody drew the tag and asked that I come along and help out. The first was a rifle hunt in the Book Cliffs back in 2010 and the second was a late muzzleloader hunt in the unit we typically hunt for the general season in 2018. Both hunts are chronicled on the Hunt Stories page. Cody was able to walk away from each hunt with very nice bucks and we had an excellent time in two very different areas of Utah. I'm actually hoping to convince another friend, Doug, to burn a couple of points as a non-resident on the same late muzzleloader hunt here in the next couple years.

Value of a Point
Each point that you accumulate has a value in that it increases your odds of drawing a tag by a certain percentage. That percentage varies depending upon the species, the unit, and even varies from year to year. For residents, you can expect each bonus point that you have to increase your odds by almost 0.287%. That means that with 0 points your average odds are 0.287%, with 1 point your average odds are 0.574%... basically take the number of bonus points you have and add 1, then multiply by 0.287. So if I have 9 points my average odds would be (9+1)*0.287 = 2.87%.
For non-residents the value of a point is 0.059% per bonus point. Follow the same formula to determine your average odds for non-residents take the number of bonus you have and add 1, then multiply by 0.059.. so if I had 9 points my average odds would be (9+1)*0.059 = 0.59%.
Some changes were made for 2020 though that the Utah DWR are hoping to relieve the point creep in the deer pool. The waiting period for successful deer applicants is now 5 years just like with elk, previously the waiting period was 2 years. The hope is that since limited entry deer and limited entry elk are similar in terms of drawing odds that this will keep successful applicants out of the applicant pool for a little bit longer allowing for more applicants to cycle through... we'll see if that is actually the result.

Applicant Pool Evaluation
Let’s get a feel for the overall applicant pool for deer using the two images below. The first image is shows the resident data, and the second image shows the non-resident data. The orange bars are the number of applicants who submitted an application for a specific hunt unit while the blue bars show the number of applicants who submitted an application to purchase the bonus point, both sets of bars correspond to the y-axis on the left. The gray line indicates the number of random numbers received by applicants who applied for a hunt unit corresponding to the second Y-axis on the right.

In the 2019 application there were more than 4200 new applicants for deer. The applicant pool for deer follows a smooth exponential curve with two blips occurring in the 1 and 2 point pools where growth in those two years seems to be slightly higher than the trend. Notice that the ratio of actual applicants compared to those who just buy the point is extremely high for deer... it seems that if somebody is applying in the deer pool they are going to apply for a hunt rather than apply for a point. Looking at the number of random numbers issued you can see just that the number of random numbers peaks at 10 points.


The non-resident pool for deer was dramatically impacted by the change about 10 years ago that allowed non-residents to apply for all limited entry and once-in-a-lifetime species. The number of applicants has increased dramatically since and has remained much higher than before. The most interesting part of this graph is that in the point pools below 10, it is about 50-50 split between applicants who apply for a unit versus applicants who buy points. This tells me that, like pronghorn, many deer applicants are simply adding on the deer point to their elk application because it's a relatively cheap investment for a potential future hunt.

Very quickly here, let's have a quick look at the percentage of applicants that apply for a hunt unit versus the percentage that purchase the point.

The trend for residents is to apply for an actual hunt unit rather than purchase a point, it is pretty consistent throughout with between 80% and 90% of the applicant pool applying for a hunt unit. Only the top point group shows a 50-50 split between point buyers and actual applicants. The non-resident applicant pool, as mentioned above, tends to have a higher percentage of point buyers but as the number of points an applicant accumulates the more likely he/she is to apply for a hunt unit... I find this an interesting trend.

Here is a look at the average number of bonus points over the last 5 years that it took to draw a Bonus Tag. I’ve included the PROJECTED 2020 average bonus points:

Here is where I typically type some things about "year savings", but in the deer pool there is no such thing. As you can see, for residents the average number of points that it takes to draw an archery, muzzleloader, or rifle tag doesn't differ by much. So when considering your choices for limited entry deer, decide which weapon you would prefer to hunt with and go for it.
The same goes for non-residents... there appears to be a slight "year savings" with muzzleloader tags but I think that corresponds to a high number of new muzzleloader hunts now being offered later in the season on our traditional general units. If you are familiar with a general unit that offers these late muzzleloader tags they are good options for a hunt that occurs in the pre-rut to early rut.

Tag Distribution
Here is a look at how the tags were distributed in 2019...
The blue line shows the number of applicants and corresponds to the first Y-axis on the left. The orange bars are the regular tags drawn and the gray bars are the bonus tags issued to the highest point holders and correspond to the second second Y-axis on the right.


Pictures

Popular Posts