Last year prior to the application period opening up I took a close look at the information that we have available to do a species by species analysis. This year I will do something similar, however rather than interpret data myself I will preface the information presented with a series of questions to provoke your own thought and digestion of the data. Each of us has very different reasons for doing what we do and why we hunt, we are in varying stages of life and have differing goals and aspirations. In the past much of my interpretation of the data has been biased towards my own strategy and I'd like to get away from that this year. Hopefully this format accomplishes that. I have tried to keep the same formatting and "look" because that consistency breeds familiarity. Overall, I want you to look at the data and ask yourself probing questions about your reasons, goals, aspirations, and abilities and come up with your own interpretation of the data and use that as your basis for decision-making. GI Joe says that, "Knowing is half the battle..."
The data that I look at is published by the Utah DWR on their website and is public information. I will take a combined look at the resident and non-resident data for the once-in-a-lifetime species, but for the limited entry species I will look at and have separate posts for resident and non-resident information. Same as last year, I will start with moose and will proceed with the once-in-a-lifetime species and finish up with the limited entry species and I will do my best to follow the schedule below so that all my analyses are available before the application period opens on Jan 28th:
- Moose - Today
- Mountain Goat - Dec 22
- Desert Bighorn - Dec 26
- Rocky Mountain Bighorn - Dec 30
- Bison - Jan 3
- Non-resident Pronghorn - Jan 7
- Resident Pronghorn - Jan 11
- Non-resident Deer - Jan 15
- Resident Deer - Jan 19
- Non-resident Elk - Jan 23
- Resident Elk - Jan 27
Subscribe below to stay up to date and please enjoy as you research for your 2021 Utah Big Game application!
Value of a Point
I subscribe to a philosophy of "point values." Each point that you accumulate has a value in that it increases your odds of drawing a tag by a certain percentage. That percentage varies depending upon the species, the unit, and even varies from year to year. In the table below, you can see that the peak of the moose point value was back in 2008 and since then the amount that each point increases your odds has decreased pretty dramatically.
For residents, you can expect each bonus point that you have to increase your odds by about 0.029%. So if I have 9 points my average odds would be (9+1)*0.029 = 0.290%.
For non-residents the value of a point is significantly less at 0.006% per bonus point. If I had 9 points my average odds would be (9+1)*0.006 = 0.060%.
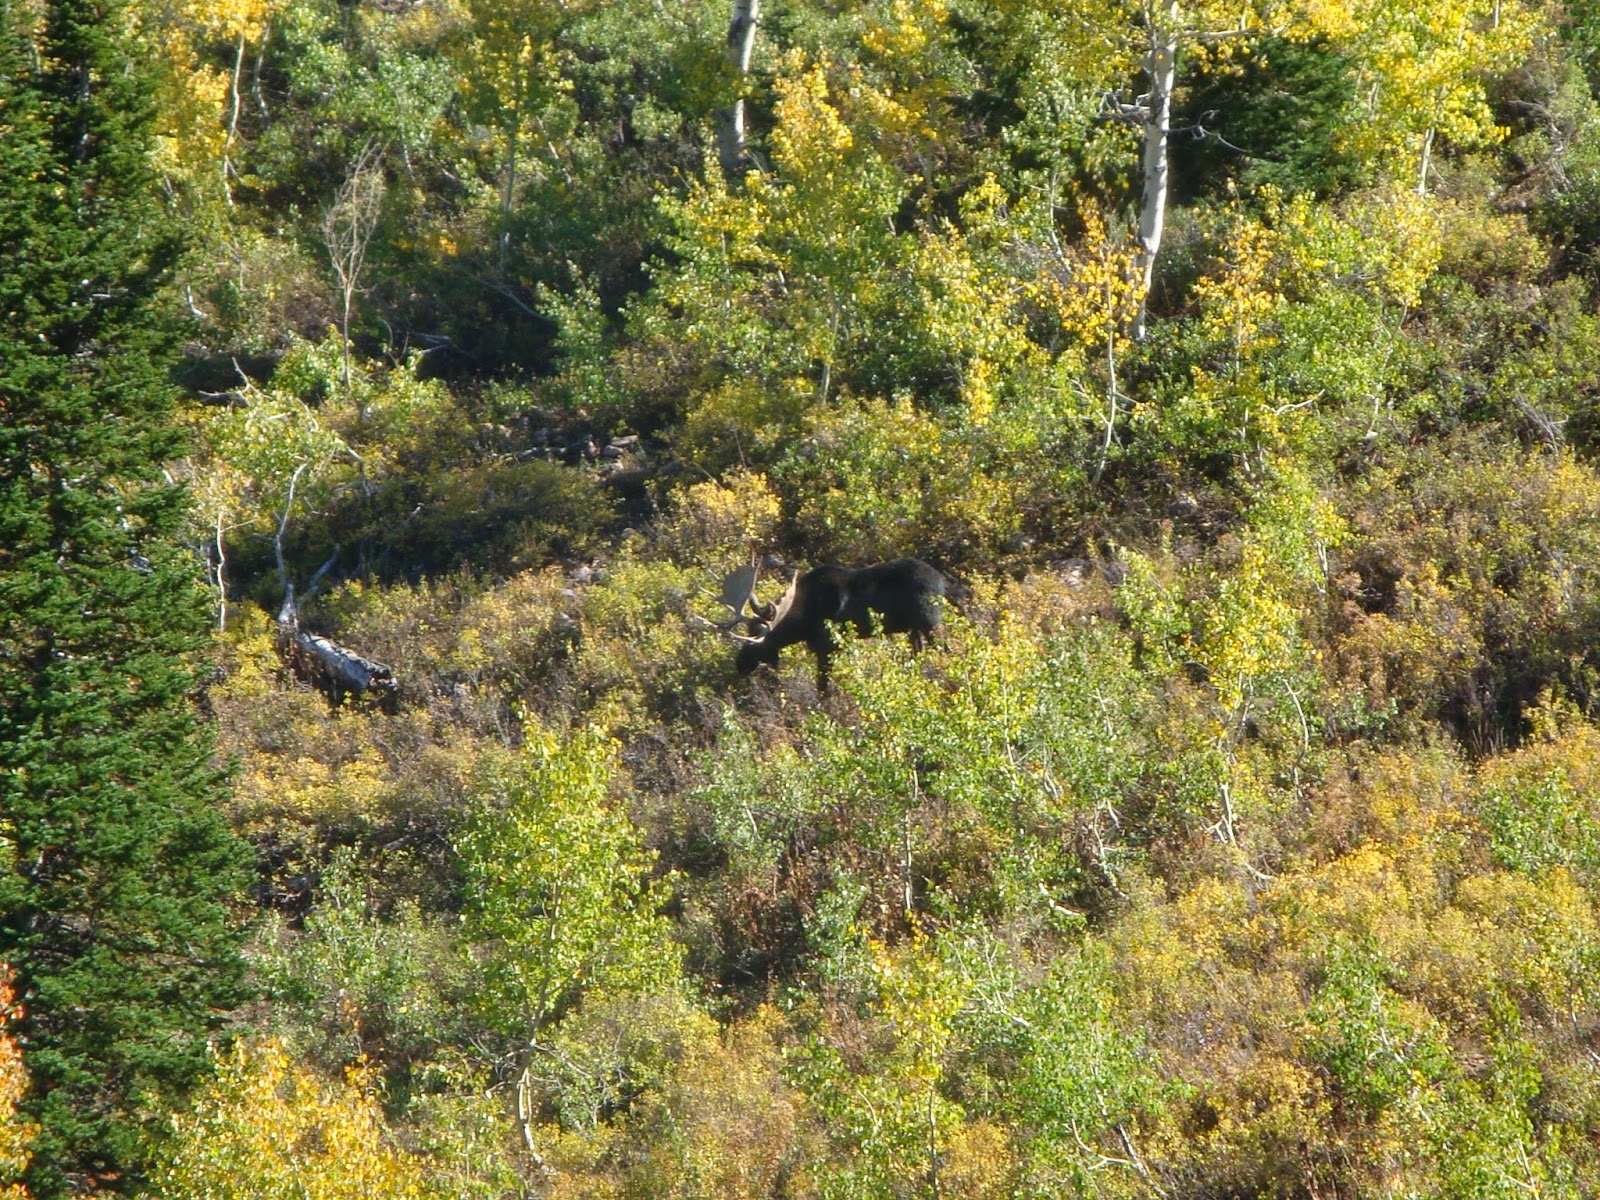
The Utah moose herd continues to struggle, the area that I do most of my hunting has historically had a high quality moose herd. Over the past several years I have noticed some pretty extreme year to year fluctuations. Two years ago we saw a number of good bulls and the cow and calf numbers were good, but last year we saw few mature bulls and very few cows. The current Moose Management Plan allows biologists to take an aggressive approach by adjusting tag allocations in bull and antlerless moose permits. Both resident and non-residents face astronomical odds at drawing a moose tag in Utah, like the other once-in-a-lifetime (OIAL) species. Expecting to draw a tag with few points should not be expected. Inevitably there will always be the extremely lucky applicants with just a small handful of points, and those lucky few are often met with a mixture of congratulations and hostility from those who have applied for years and years. My grandfather finally drew a moose tag in 2004 with max points at the time after applying annually for more than 30 years.
 |
| My grandfather's 2004 Bull Moose |
One item to pay particular attention to in the moose application (and all OIAL applicants) is the number of tags offered. If one tag was offered last year, then it is highly likely that only one tag will be offered this year. When only one tag is offered that tag is drawn through random lottery drawing. This is especially of concern for resident applicants applying for CWMU hunts, the majority of these hunts only offer a single tag so the drawing is a random lottery. Those looking to take full advantage of their bonus points should be looking for units that offer two or more tags. Many applicants are beginning to view these CWMU options as viable alternate choices to the standard public land hunts where drawing a tag may be a lot sooner coming. Again, be aware that most CWMU units only offer a single bull moose permit so no bonus permits are issued and the drawing is performed as a weighted lottery so it is possible that an applicant could apply for one of these and never draw the permit regardless of the number of bonus points that he or she has.
Applicant Pool Evaluation
The best knowledge that you can have going into any application period is what the environment around you looks like and getting a feel for what the applicant pool has been doing based upon prior year data. All of the following charts were generated utilizing this raw data taken from the 2020 Bucks, Bulls, and Once-in-a-Lifetime Drawing Odds Report :
The images that follow are a series of charts presenting the raw data in a more visual format. Again, I will refrain from interjecting my own opinion and allow you to interpret the data shown on your own... we each approach hunting with their own strategy based upon different goals and aspirations so it would be unfair for me to attempt to influence or encourage or discourage anyone because I would be speaking based solely upon my own goals and aspirations. That being said, I would encourage you to ask yourself the following questions as you look at each chart:
- Is drawing a tag for this species a part of my long term, mid term, or short term strategy?
- Where am I on this chart... what point group am I in and what is happening in the groups around me?
- Is where I am at on these charts encouraging or discouraging?
- Are there any trends that are interesting? Do I know what is causing that trend?
- How can "Point Buyers" impact me in the short term and in the long term?
- How do the answers to the previous questions impact my strategy?
- Am I willing to stick to my strategy for this species or do I need to re-evaluate?
The first series of images shows the number of actual applicants (yellow bars), the number of point buyers (blue bars), and the number of random numbers issued (gray line) for each point level:
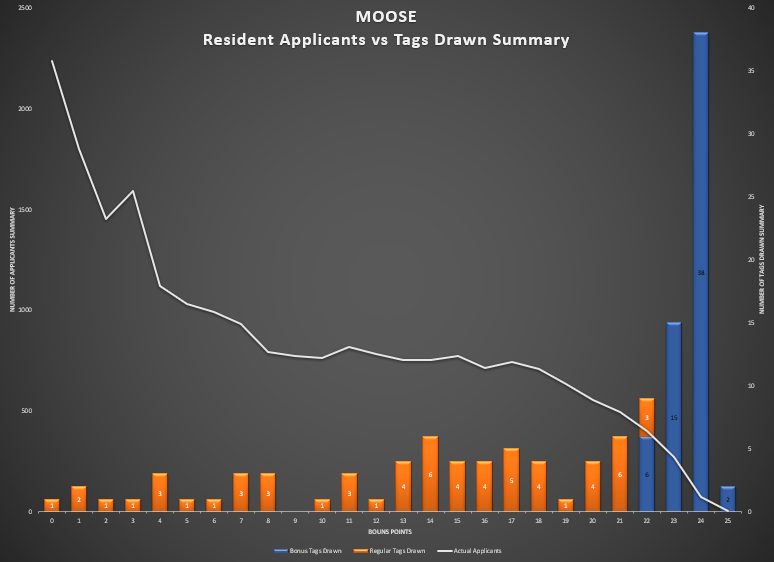
This second series of images shows the distribution of bonus tags (blue bars), random/lottery tags (orange bars), and the number of applicants (gray line) in 2020.
The final series of charts shows the percentage of actual applicants (orange bars) compared to the percentage of point buyers (blue bars).