
I began putting together this spreadsheet several years ago and over the course of time I have added additional information as my understanding of the process has grown. I have made two major changes this year to the spreadsheet. The first major change was to combine the resident and non-resident data onto the same sheet. The main reason for this was because over the past couple years many of my hunting buddies have moved to other states to pursue their careers and I wanted a way to see the data for them and me simultaneously. The second major change was to add columns indicating how many years an applicant would have to continue to apply for a specific hunt before being considered within the bonus point pool for that tag. There is a minimum and maximum column indicating when the applicant should expect to at minimum be part of the bonus point pool (min) and when all the applicants within that pool should have received a bonus tag (max). Keep in mind that the application is ever changing and these numbers are based upon the most recent drawing results. They provide a pretty good ballpark estimate but should not be considered as absolute.
To give you an idea how I use the spreadsheet in researching drawing odds and units of interest for future applications I'll walk through an example of some of the options that you can consider using the sort and filter functinos built into Excel. While nearly all the columns on the spreadsheet can be sorted/filtered, the "Years to Draw" columns are a text field (non-numeric) so at this time they do not sort in ascending/descending order correctly. I'm investigating alternative methods to generate and display this data in a way that would be sortable, but until I am able to find a method or format that satisfies me please consider this a limitation of these columns.
First thing is first... click on the link at the left to download the spreadsheet. You will need to be logged into your Google account to do so. This spreadsheet includes the drawing data for all limited entry and once-in-a-lifetime big game species. I will use the LE Bull Elk tab in this tutorial, however the data for all other species can be found by clicking the appropriate tab on the bottom left for the species that you would like to research.
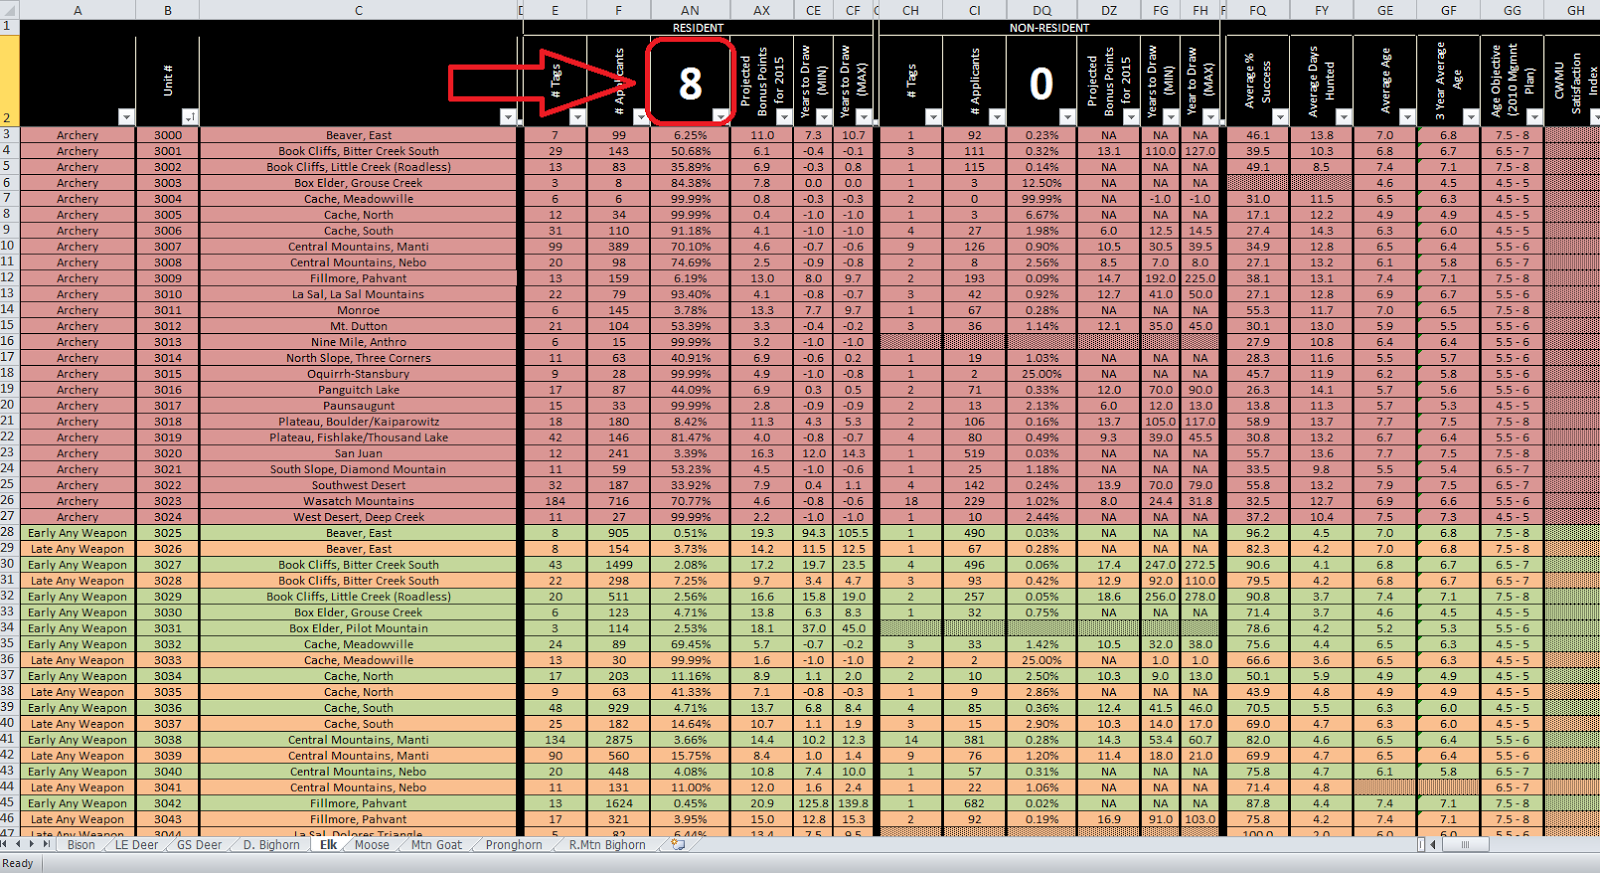
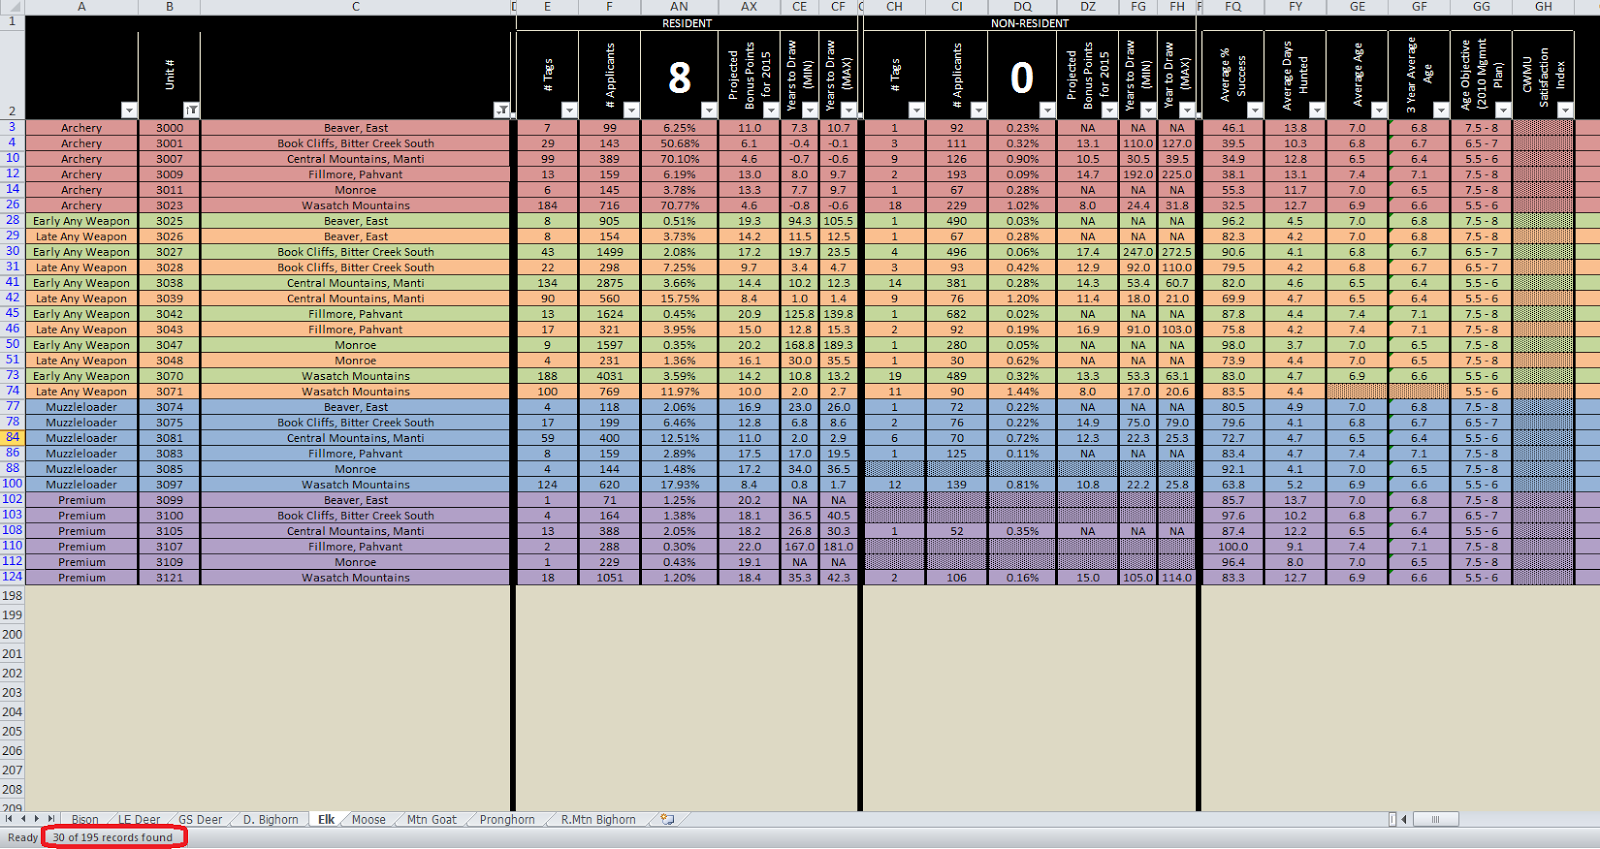
Open the spreadsheet and quickly familiarize yourself with the column headings. This is what the elk tab of spreadsheet should look like:
 Since I am a Utah resident I will enter the number of LE bull elk bonus points that I have in the resident portion of the spreadsheet. Once I click enter, notice that several of the columns change. The formulas built into the cells, specifically the perentages in the column below my "8" and the Years Draw (Min) and (Max) columns, are based upon the number of bonus points an applicant has. These columns automatically re-populate with data based upon the number of bonus points the user enters.
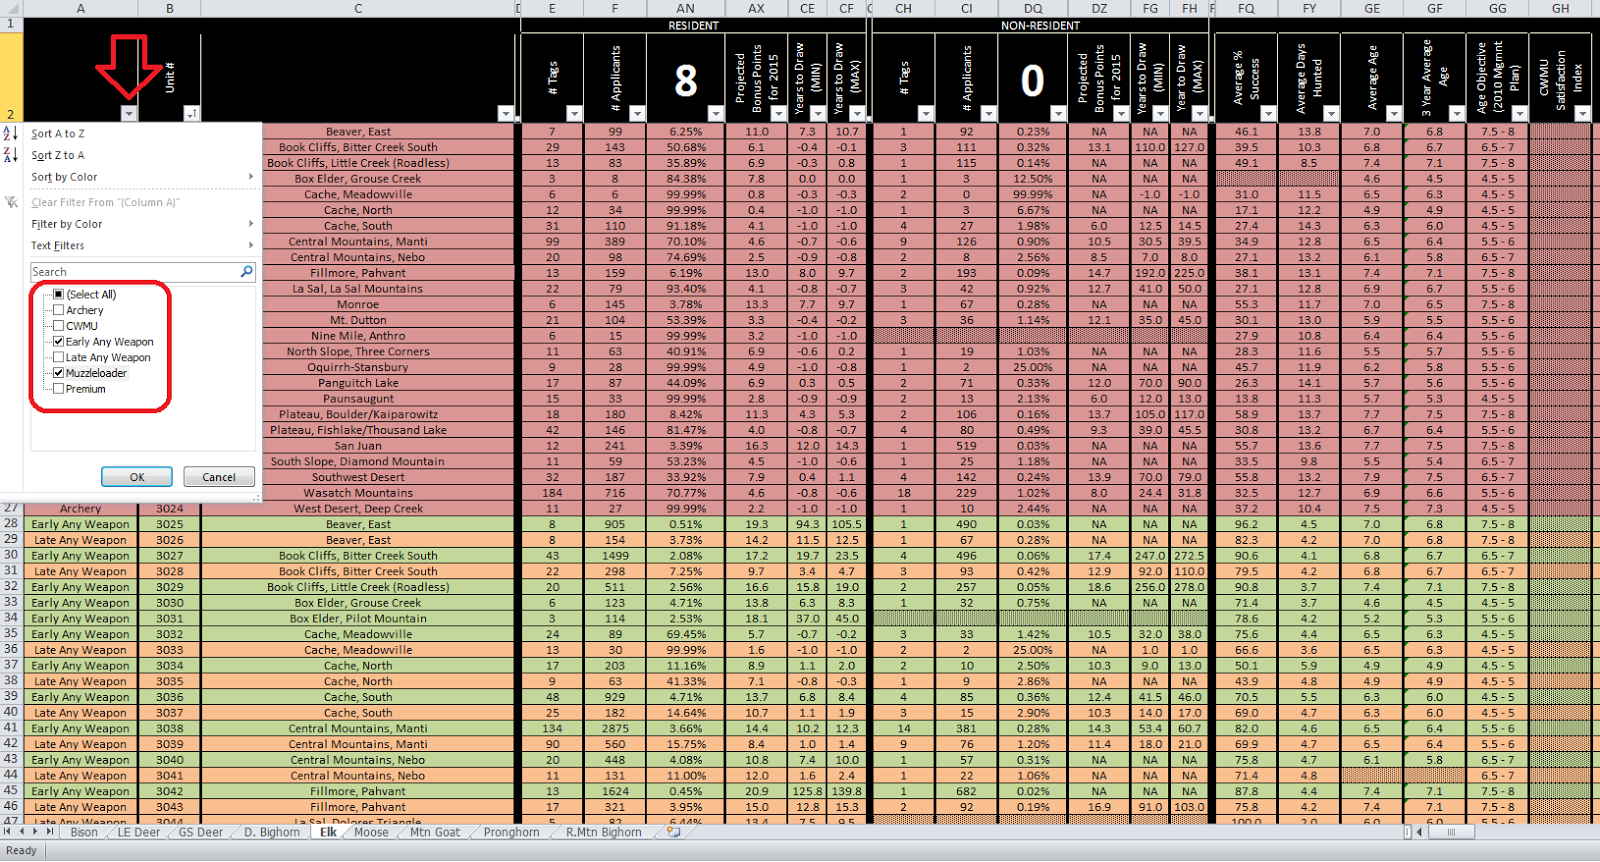
One of the tips that I gave on the "Tips for Improving Your Drawing Odds" page was to know and understand your expectations... this is where we really start to dive into those expectations that we have and begin to see how those expectations affect our odds of drawing a permit.I personally desire to hunt bull elk during the rut. So that eliminates the late any weapon from my consideration. I haven't pursued game with archery tackle in years so my proficiency with archery tackle is highly questionable, eliminating archery from my consideration. I also want to pursue bull elk on public land. Although the CWMU program is great, it does not fall in line with my expectations of this hunt, so I will eliminate the CWMU units from my consideration. The cost of a limited entry permit is already high enough, I am not willing to pay double or more that price for a premium permit that would allow me to hunt all open seasons. I don't have the time to dedicate to that permit either, so I will eliminate the premium units from my consideration. That leaves me with the early any weapon and the muzzleloader hunts for me to begin my research. Using the Sort/Filter drop down menus I make those selections based upon my weapon choices. I select oly the boxes for "Early Any Weapon" and "Muzzleloader."
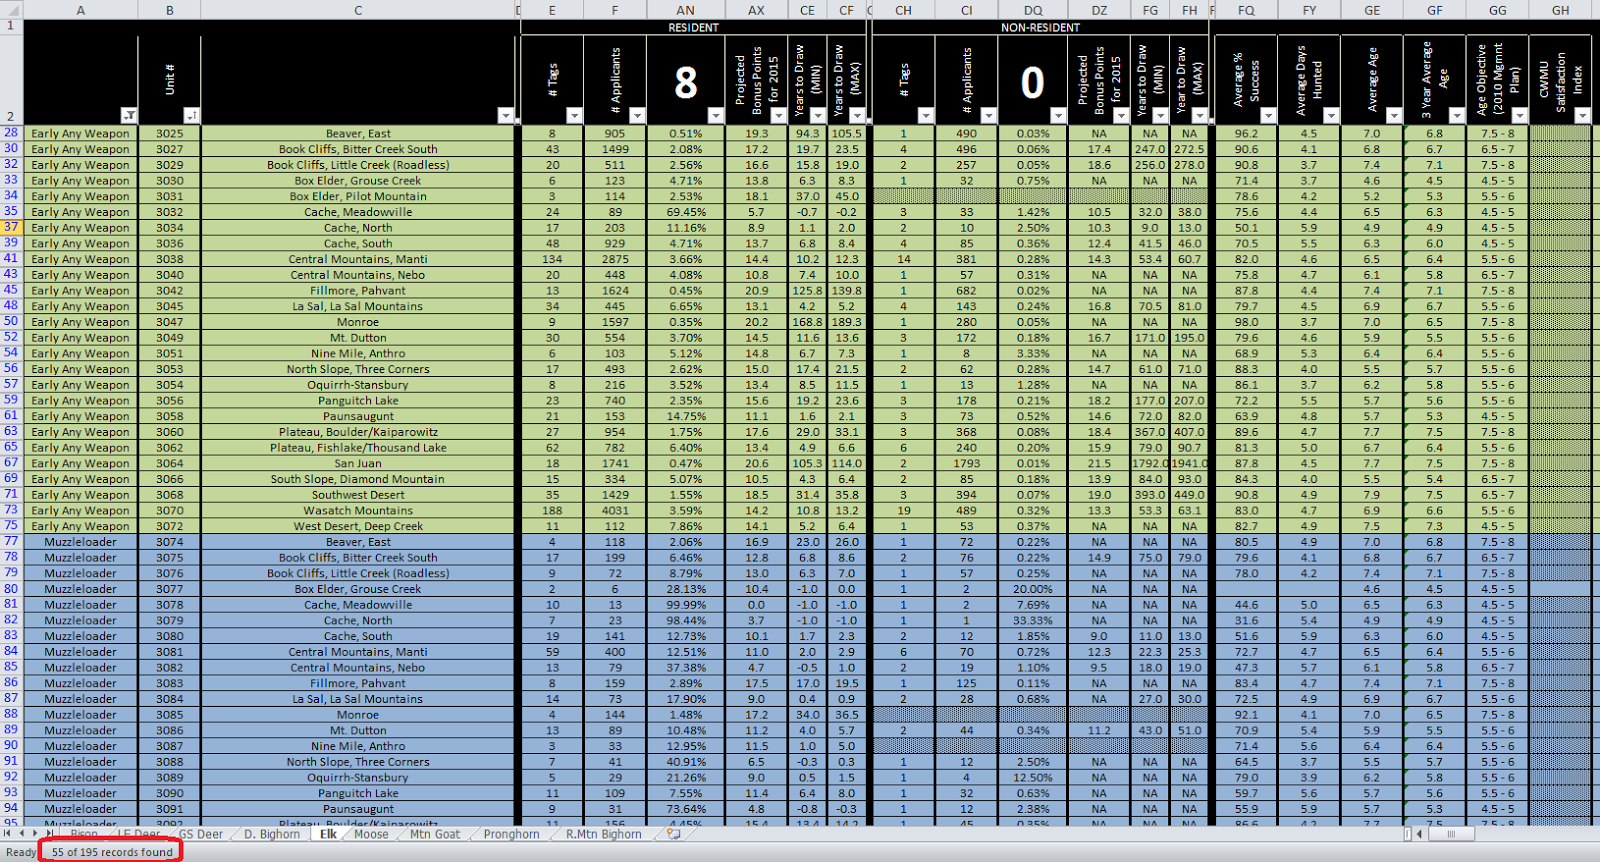
The spreadsheeet hides the data for all the archery, late any weapon, premium, and CWMU units only showing me the early any weapon and muzzleloader unit data. I essentially went from considering 195 units to 55 units.
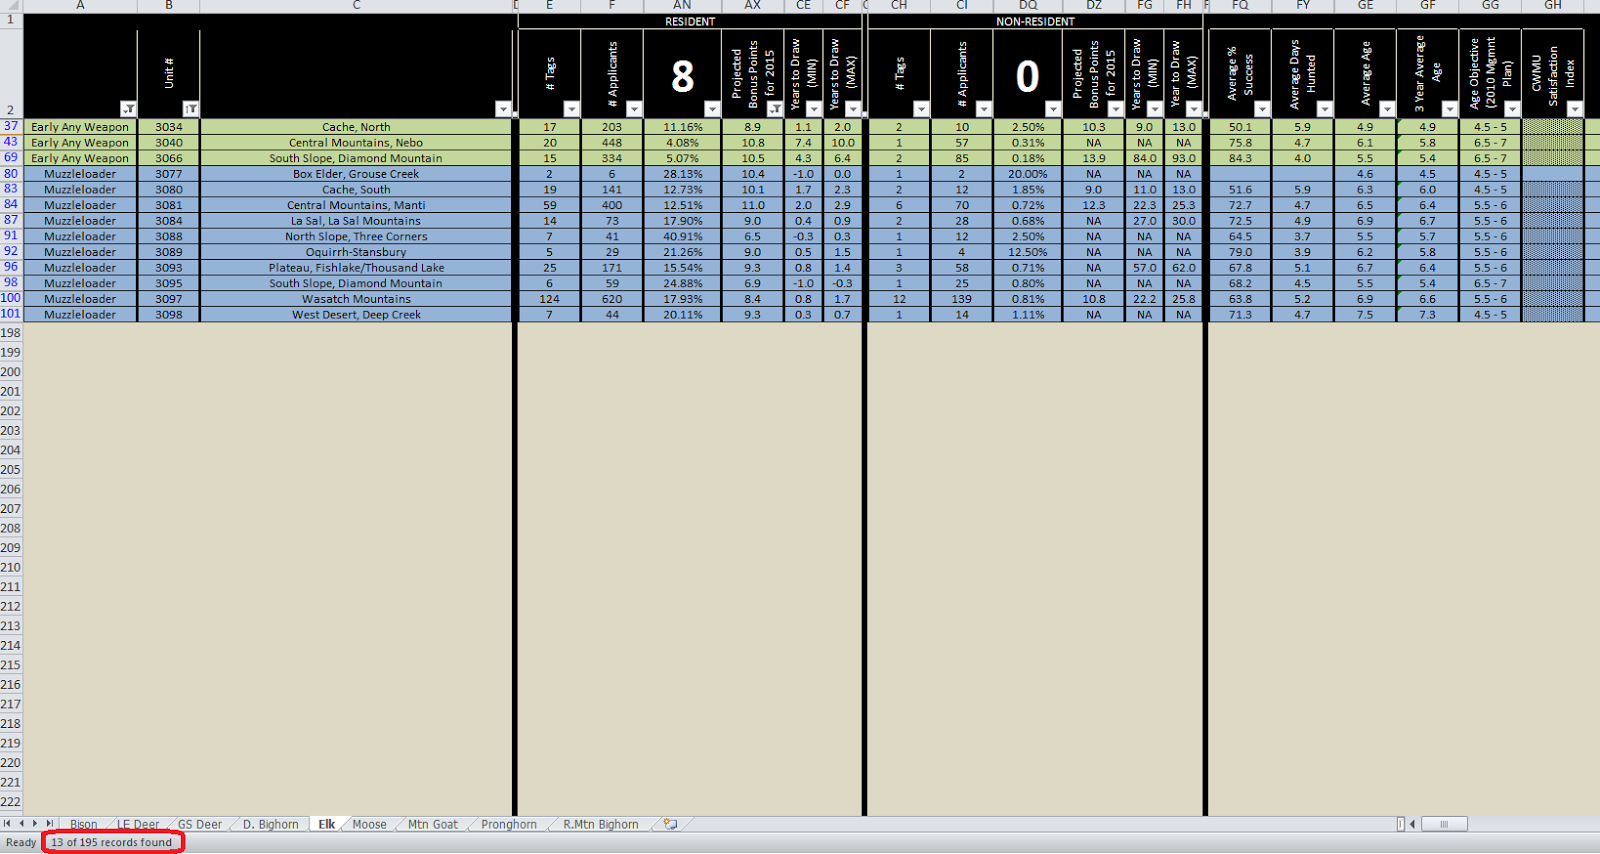
Even though the number of units to begin researching (now 55) is better, it's still very high so let's consider some of my other expectations. I don't want to be waiting for an elk tag for much longer so I'd like to look for a unit that would statistically provide me the opportunity at being guaranteed a permit within the next couple years. Using the Sort/Filter drop down menu for the "Projected Bonus Points for 2015" column I'll select for those units that are projected to award the bonus tags between 8 and 12 bonus points.
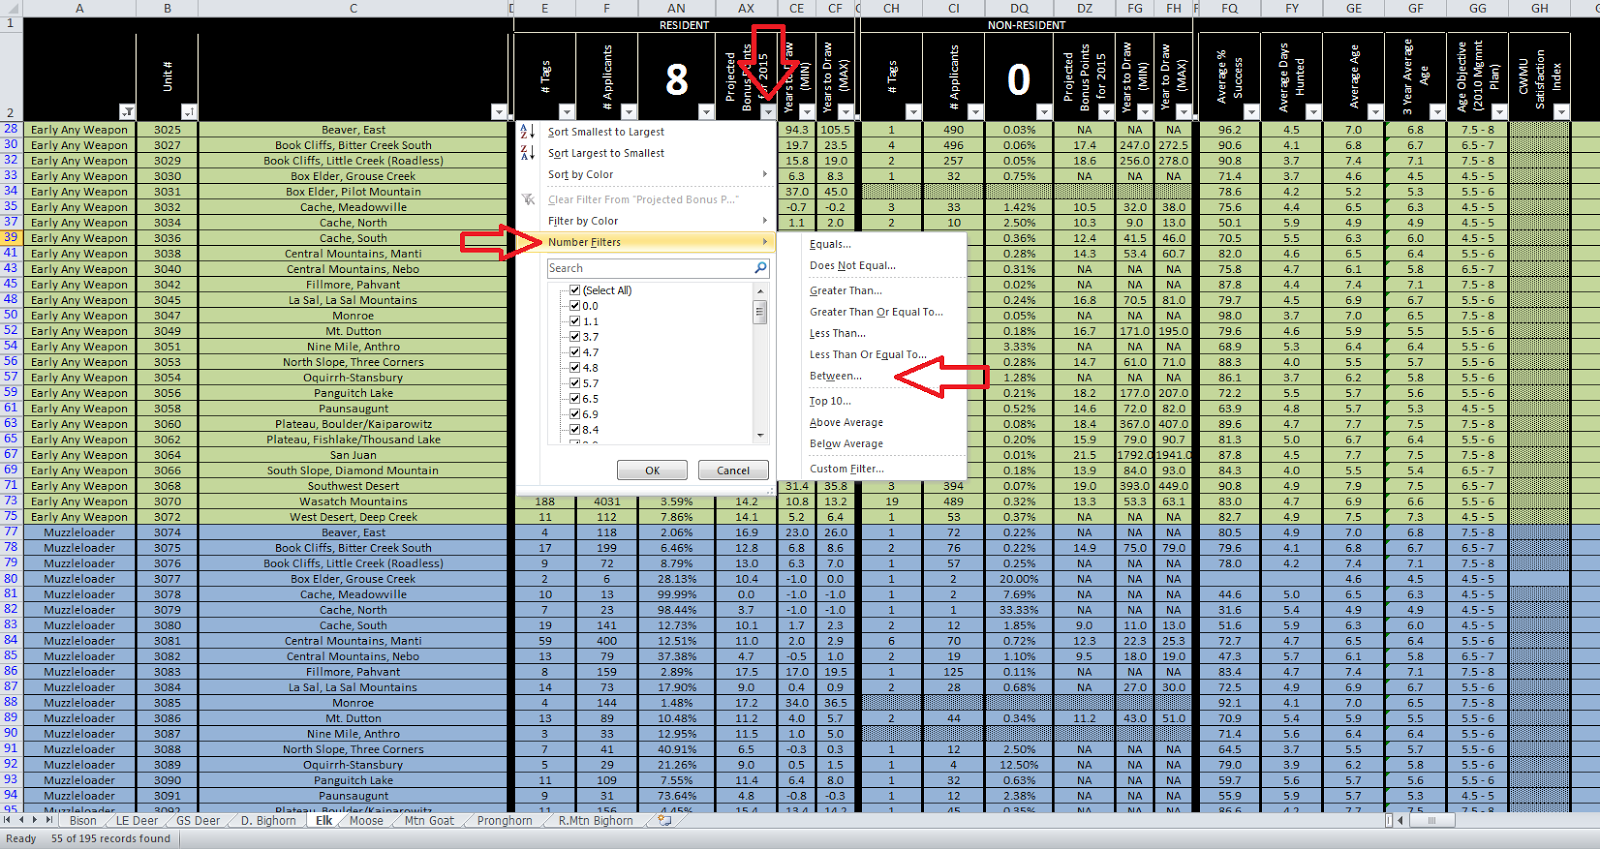
This really narrows down the options to a realistic number to begin my reasearch. From the original 195 bull elk units I have now found 13 of them that meet my inital criteria.
In my research I would also like to consider one of my non-resident hunting buddies, so I'll enter his 6 bonus points into the non-resident portion of the spreadsheet.
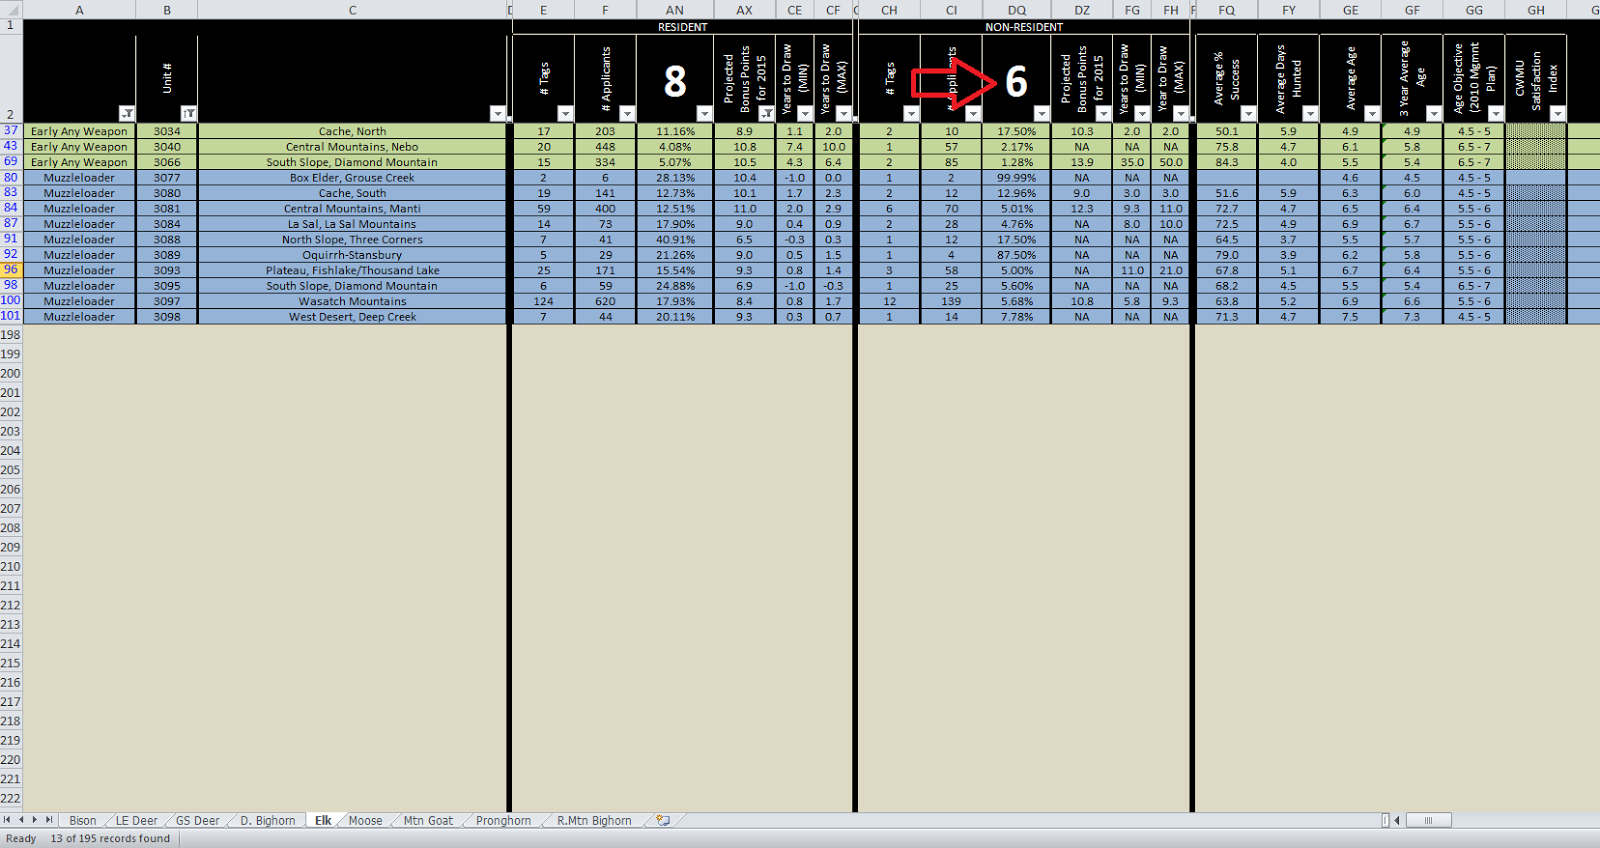
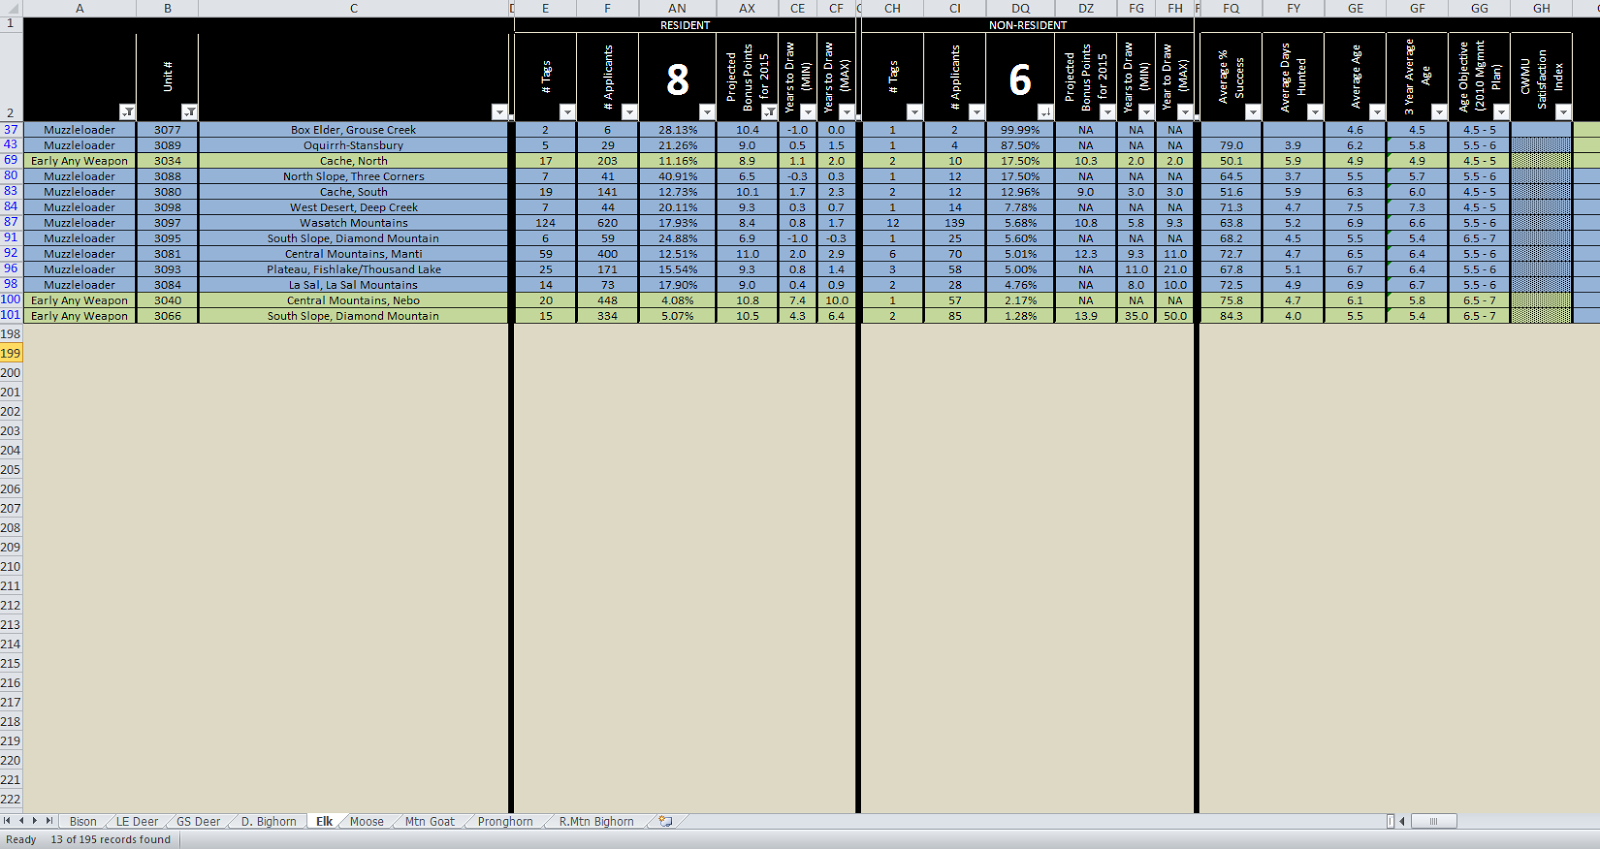
This re-populates the non-resident data to reflect his 6 bonus points. I then use the Sort/Filter drop down menu to sort the non-resident percentages from highest to lowest. I will begin to research the units in this order.
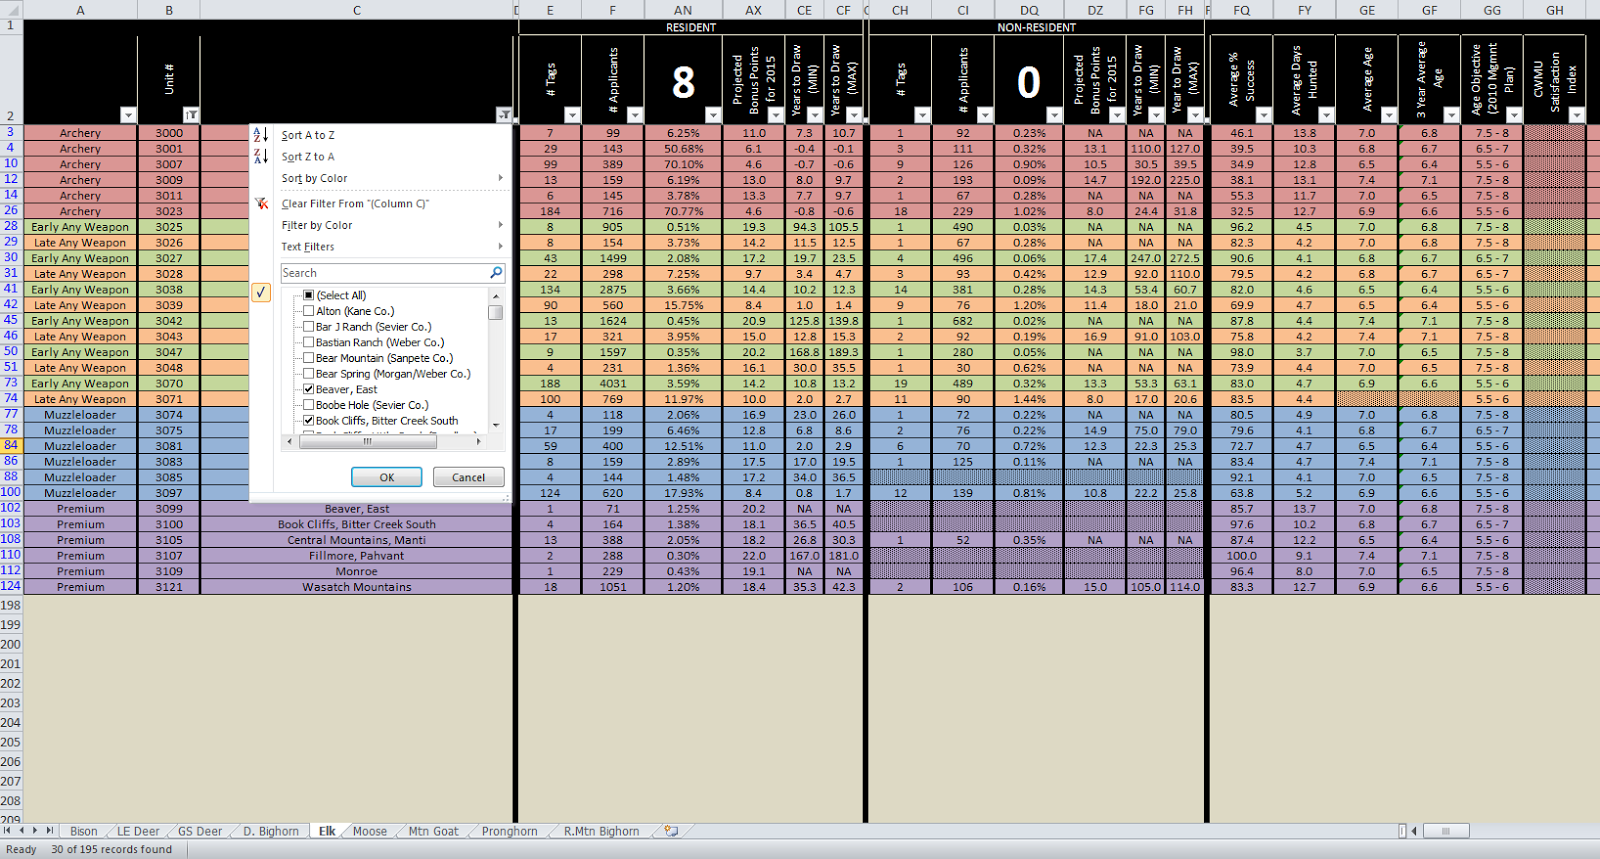
Now let's look at this data in another way and we'll start from the beginning. Say that I have a list of hunt units that I am interested in. I have done a little bit of research up front and have found some information that has caused me to become interested in a handful of specific units within the state. I can use the sort/filter drop down menu to specifically select only those units that have piqued my interest.
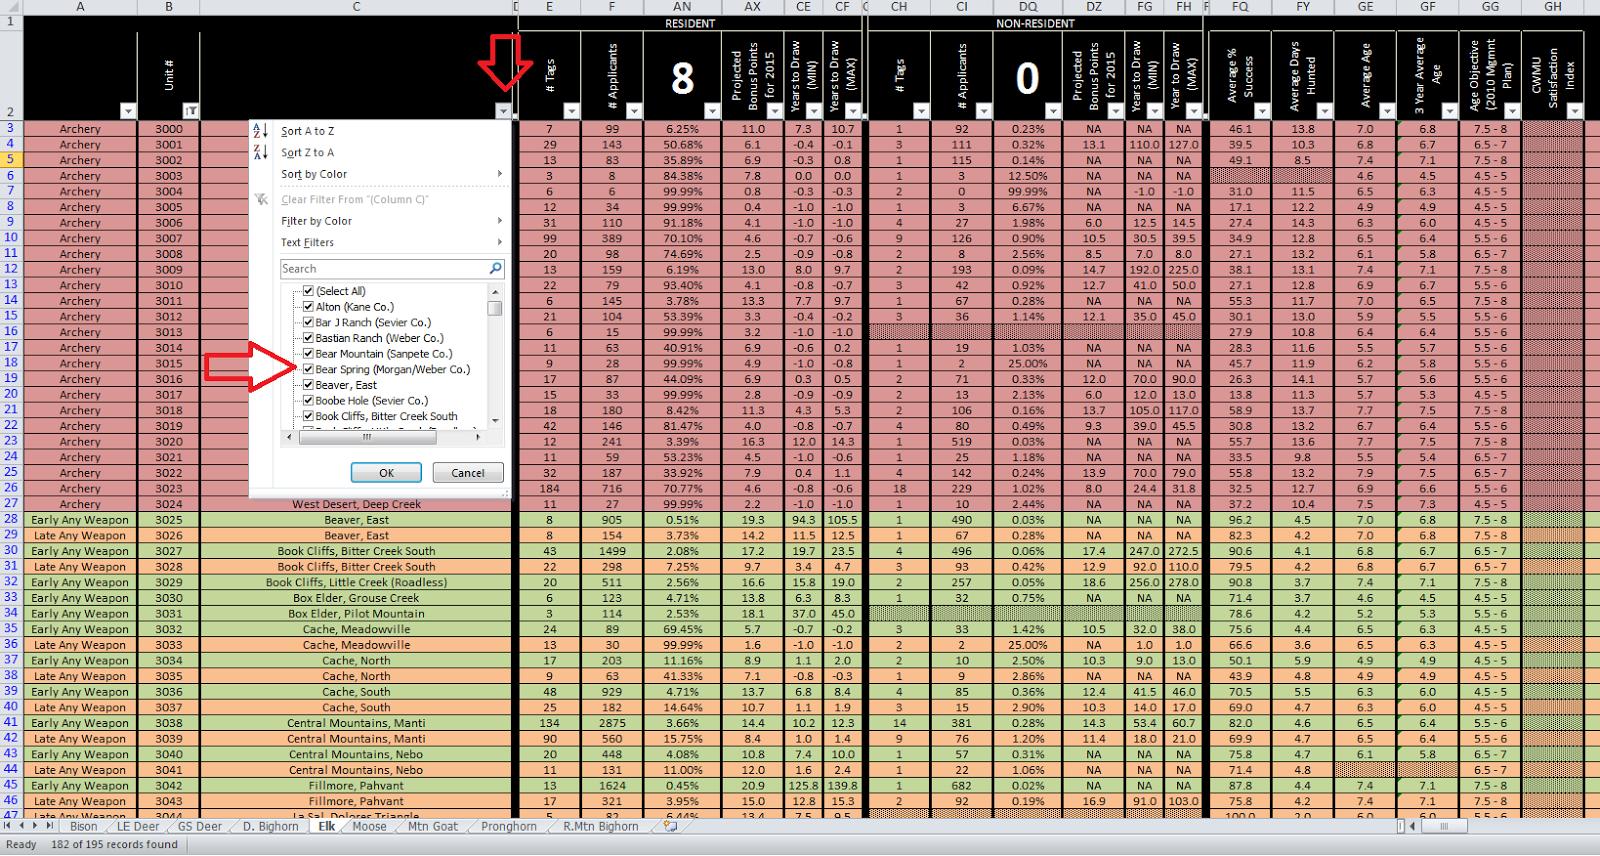
For this example let's say that I selected 6 units that I'm interested in: the Beaver, East; Book Cliffs, Bitter Creek South; Central Mountains, Manti; Fillmore, Pahvant; Monroe; and the Wasatch Mountains. The spreadsheet now shows only the data for those units.
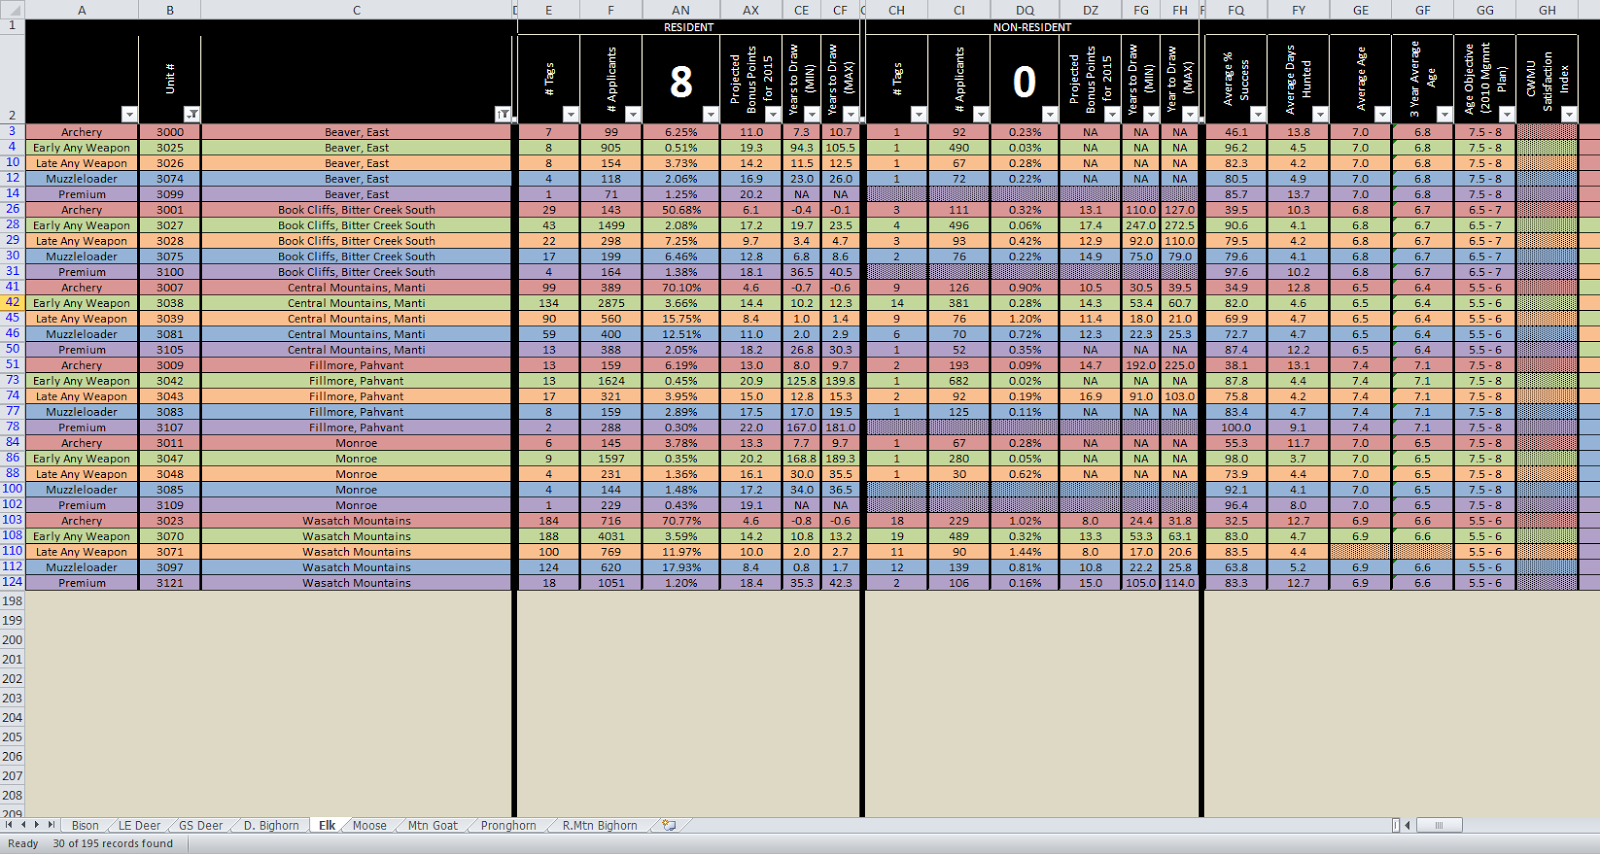
From here I can quicly use the sort/filter drop down to alphabetize this list.
This spreadsheet view now allows me to quickly look at how difficult it would be drawn a permit in one of the specific units that I am interested in.
I could go back and modify any or all of my criteria by selecting the corresponding filter drop down menu, or even start over by selecting “Clear Filter from (Column name).” The filtering and sorting options are virtually limitless and can be set to meet even the strictest criteria.To give you an idea how I use the spreadsheet in researching drawing odds and units of interest for future applications I'll walk through an example of some of the options that you can consider using the sort and filter functinos built into Excel. While nearly all the columns on the spreadsheet can be sorted/filtered, the "Years to Draw" columns are a text field (non-numeric) so at this time they do not sort in ascending/descending order correctly. I'm investigating alternative methods to generate and display this data in a way that would be sortable, but until I am able to find a method or format that satisfies me please consider this a limitation of these columns.
First thing is first... click on the link at the left to download the spreadsheet. You will need to be logged into your Google account to do so. This spreadsheet includes the drawing data for all limited entry and once-in-a-lifetime big game species. I will use the LE Bull Elk tab in this tutorial, however the data for all other species can be found by clicking the appropriate tab on the bottom left for the species that you would like to research.
Open the spreadsheet and quickly familiarize yourself with the column headings. This is what the elk tab of spreadsheet should look like:
One of the tips that I gave on the "Tips for Improving Your Drawing Odds" page was to know and understand your expectations... this is where we really start to dive into those expectations that we have and begin to see how those expectations affect our odds of drawing a permit.I personally desire to hunt bull elk during the rut. So that eliminates the late any weapon from my consideration. I haven't pursued game with archery tackle in years so my proficiency with archery tackle is highly questionable, eliminating archery from my consideration. I also want to pursue bull elk on public land. Although the CWMU program is great, it does not fall in line with my expectations of this hunt, so I will eliminate the CWMU units from my consideration. The cost of a limited entry permit is already high enough, I am not willing to pay double or more that price for a premium permit that would allow me to hunt all open seasons. I don't have the time to dedicate to that permit either, so I will eliminate the premium units from my consideration. That leaves me with the early any weapon and the muzzleloader hunts for me to begin my research. Using the Sort/Filter drop down menus I make those selections based upon my weapon choices. I select oly the boxes for "Early Any Weapon" and "Muzzleloader."
The spreadsheeet hides the data for all the archery, late any weapon, premium, and CWMU units only showing me the early any weapon and muzzleloader unit data. I essentially went from considering 195 units to 55 units.
Even though the number of units to begin researching (now 55) is better, it's still very high so let's consider some of my other expectations. I don't want to be waiting for an elk tag for much longer so I'd like to look for a unit that would statistically provide me the opportunity at being guaranteed a permit within the next couple years. Using the Sort/Filter drop down menu for the "Projected Bonus Points for 2015" column I'll select for those units that are projected to award the bonus tags between 8 and 12 bonus points.
This really narrows down the options to a realistic number to begin my reasearch. From the original 195 bull elk units I have now found 13 of them that meet my inital criteria.
In my research I would also like to consider one of my non-resident hunting buddies, so I'll enter his 6 bonus points into the non-resident portion of the spreadsheet.
This re-populates the non-resident data to reflect his 6 bonus points. I then use the Sort/Filter drop down menu to sort the non-resident percentages from highest to lowest. I will begin to research the units in this order.
Now let's look at this data in another way and we'll start from the beginning. Say that I have a list of hunt units that I am interested in. I have done a little bit of research up front and have found some information that has caused me to become interested in a handful of specific units within the state. I can use the sort/filter drop down menu to specifically select only those units that have piqued my interest.
For this example let's say that I selected 6 units that I'm interested in: the Beaver, East; Book Cliffs, Bitter Creek South; Central Mountains, Manti; Fillmore, Pahvant; Monroe; and the Wasatch Mountains. The spreadsheet now shows only the data for those units.
From here I can quicly use the sort/filter drop down to alphabetize this list.
This spreadsheet view now allows me to quickly look at how difficult it would be drawn a permit in one of the specific units that I am interested in.
There are additional columns for average age class of bulls harvested, average days hunted, and average % success that can sorted/filtered even further to really drill down on specific units that would fit certain expectations.


.jpg)

