
Bonus point or preference point systems are currently being used in many western states. Though the systems may vary slightly from state to state, the systems were put in place to increase your chance of ultimately drawing a big game tag. In about 1993, Utah instituted its bonus/preference point system and currently utilizes a bonus point system for limited entry (LE) and once-in-a-lifetime (OIAL) permits and a preference point system for general buck deer and antlerless permits.
There are many nuances to both of these systems... and understanding how each system works will ultimately benefit the applicant. I'll discuss a number of details that I feel are critical to understand in order to make the most of your application for a Utah big game permit.
Clearly, I'm a bit of a statistics and numbers nut... so I'll also provide my own analysis of the drawing results for each species along with some personal commentary on ways to improve your chances of eventually drawing a Utah big game permit. This commentary is purely personal opinion derived from years of applying for myself and family members for permits in Utah and personal interpretation of the drawing results published by the Utah DWR. This commentary is free & as the saying goes... "you get what you pay for!"

I've had the opportunity to take part in two limited entry deer hunts. In both instances my friend Cody drew the tag and asked that I come along and help out. The first was a rifle hunt in the Book Cliffs back in 2010 and the second was a late muzzleloader hunt in the unit we typically hunt for the general season in 2018. Both hunts are chronicled on the Hunt Stories page. Cody was able to walk away from each hunt with very nice bucks and we had an excellent time in two very different areas of Utah. I'm actually hoping to convince another friend, Doug, to burn a couple of points as a non-resident on the same late muzzleloader hunt here in the next couple years.
Value of a Point

Each point that you accumulate has a value in that it increases your odds of drawing a tag by a certain percentage. That percentage varies depending upon the species, the unit, and even varies from year to year. For residents, you can expect each bonus point that you have to increase your odds by almost 0.287%. That means that with 0 points your average odds are 0.287%, with 1 point your average odds are 0.574%... basically take the number of bonus points you have and add 1, then multiply by 0.287. So if I have 9 points my average odds would be (9+1)*0.287 = 2.87%.
For non-residents the value of a point is 0.059% per bonus point. Follow the same formula to determine your average odds for non-residents take the number of bonus you have and add 1, then multiply by 0.059.. so if I had 9 points my average odds would be (9+1)*0.059 = 0.59%.
Some changes were made for 2020 though that the Utah DWR are hoping to relieve the point creep in the deer pool. The waiting period for successful deer applicants is now 5 years just like with elk, previously the waiting period was 2 years. The hope is that since limited entry deer and limited entry elk are similar in terms of drawing odds that this will keep successful applicants out of the applicant pool for a little bit longer allowing for more applicants to cycle through... we'll see if that is actually the result.
Applicant Pool Evaluation
Let’s get a feel for the overall applicant pool for pronghorn using the two images below. The first image is shows the resident data, and the second image shows the non-resident data. The orange bars are the number of applicants who submitted an application for a specific hunt unit while the blue bars show the number of applicants who submitted an application to purchase the bonus point, both sets of bars correspond to the y-axis on the left. The gray line indicates the number of random numbers received by applicants who applied for a hunt unit corresponding to the second Y-axis on the right.

In the 2019 application there were more than 4200 new applicants for deer. The applicant pool for deer follows a smooth exponential curve with two blips occurring in the 1 and 2 point pools where growth in those two years seems to be slightly higher than the trend. Notice that the ratio of actual applicants compared to those who just buy the point is extremely high for deer... it seems that if somebody is applying in the deer pool they are going to apply for a hunt rather than apply for a point. Looking at the number of random numbers issued you can see just that the number of random numbers peaks at 10 points.

The non-resident pool for deer was dramatically impacted by the change about 10 years ago that allowed non-residents to apply for all limited entry and once-in-a-lifetime species. The number of applicants has increased dramatically since and has remained much higher than before. The most interesting part of this graph is that in the point pools below 10, it is about 50-50 split between applicants who apply for a unit versus applicants who buy points. This tells me that, like pronghorn, many deer applicants are simply adding on the deer point to their elk application because it's a relatively cheap investment for a potential future hunt.
Very quickly here, let's have a quick look at the percentage of applicants that apply for a hunt unit versus the percentage that purchase the point.


The trend for residents is to apply for an actual hunt unit rather than purchase a point, it is pretty consistent throughout with between 80% and 90% of the applicant pool applying for a hunt unit. Only the top point group shows a 50-50 split between point buyers and actual applicants. The non-resident applicant pool, as mentioned above, tends to have a higher percentage of point buyers but as the number of points an applicant accumulates the more likely he/she is to apply for a hunt unit... I find this an interesting trend.
Here is a look at the average number of bonus points over the last 5 years that it took to draw a Bonus Tag. I’ve included the PROJECTED 2020 average bonus points:

Here is where I typically type some things about "year savings", but in the deer pool there is no such thing. As you can see, for residents the average number of points that it takes to draw an archery, muzzleloader, or rifle tag doesn't differ by much. So when considering your choices for limited entry deer, decide which weapon you would prefer to hunt with and go for it.
The same goes for non-residents... there appears to be a slight "year savings" with muzzleloader tags but I think that corresponds to a high number of new muzzleloader hunts now being offered later in the season on our traditional general units. If you are familiar with a general unit that offers these late muzzleloader tags they are good options for a hunt that occurs in the pre-rut to early rut.
Tag Distribution
Here is a look at how the tags were distributed in 2019...
The blue line shows the number of applicants and corresponds to the first Y-axis on the left. The orange bars are the regular tags drawn and the gray bars are the bonus tags issued to the highest point holders and correspond to the second second Y-axis on the right.


Pictures


In 2014 my grandfather drew a Central Mountains, Manti early rifle tag. It was a summer filled with excitement and expectations as we prepared for the hunt. Ultimately it didn't end up how we had anticipated and was honestly a rather frustrating string of events but it was not without a couple of close encounters that we should have capitalized on. Gramps hunt is chronicled on the Hunt Stories page. I'm currently sitting on enough points to be in very good shape to draw the hunt that I have been targeting since that hunt with my grandpa in 2014. 2020 should be the year for me to draw my first limited entry tag.
Value of a Point

Each point that you accumulate has a value in that it increases your odds of drawing a tag by a certain percentage. That percentage varies depending upon the species, the unit, and even varies from year to year. For residents, you can expect each bonus point that you have to increase your odds by about 0.407%. That means that with 0 points your average odds are 0.407%, with 1 point your average odds are 0.814%... basically take the number of bonus points you have and add 1, then multiply by 0.407. So if I have 9 points my average odds would be (9+1)*0.407 = 4.07%.
For non-residents the value of a point is about 0.108% per bonus point. Follow the same formula to determine your average odds for non-residents take the number of bonus you have and add 1, then multiply by 0.108.. so if I had 9 points my average odds would be (9+1)*0.108 = 1.08%.
Applicant Pool Evaluation
Let’s get a feel for the overall applicant pool for elk using the two images below. The first image is shows the resident data, and the second image shows the non-resident data. The orange bars are the number of applicants who submitted an application for a specific hunt unit while the blue bars show the number of applicants who submitted an application to purchase the bonus point, both sets of bars correspond to the y-axis on the left. The gray line indicates the number of random numbers received by applicants who applied for a hunt unit corresponding to the second Y-axis on the right.

The elk applicant pool is by far the largest of all limited entry or once-in-a-lifetime applicant pools with 7700 plus new applicants last year. The applicant pool for elk follows a smooth exponential curve with two blips occurring in the 1 and 2 point pools where growth in those two years seems to be slightly higher than the trend. Notice that the ratio of actual applicants compared to those who just buy the point is high for elk just like it was with the deer and pronghorn applicant pools... if an applicant is applying for any of the limited entry species they are in it to actually draw a tag rather than bank a point. Looking at the number of random numbers issued you can see just that the number of random numbers peaks at 5 points but declines slowly until the 14 point pool, after the 14 point pool the number of random numbers declines more rapidly.

The non-resident pool for elk was dramatically impacted by the change about 10 years ago that allowed non-residents to apply for all limited entry and once-in-a-lifetime species. The number of applicants has increased dramatically since and has remained much higher than before. The most interesting part of this graph is that in all point pools it is about 50-50 split between applicants who apply for a unit versus applicants who buy points. The data that I have presented tells me that non-resident applicants are looking to hunt elk in Utah, other species applied for are inexpensive add-ons to the elk application.
Very quickly here, let's have a quick look at the percentage of applicants that apply for a hunt unit versus the percentage that purchase the point.


The trend for residents is to apply for an actual hunt unit rather than purchase a point, it is pretty consistent throughout with between 70% and 80% of the applicant pool applying for a hunt unit. Only the top point groups show a higher prevalence of point buyers than actual applicants. For those with very high point totals and targeting the top tier units in the state, these point buyers need to be considered as they will eventually apply for a unit and impact those with point totals below them. The non-resident applicant pool the percentage of actual applicants is between 50% and 60% except for at the highest point pool where there is a tendency to buy a point rather than apply for a hunt.
Here is a look at the average number of bonus points over the last 5 years that it took to draw a Bonus Tag. I’ve included the PROJECTED 2020 average bonus points:

The limited entry elk pool is where applicants can really save themselves several years of applying unsuccessfully by choosing archery, muzzleloader, or a later rifle season. I call this "year savings." For residents, multi-season tags are a premium tag and bonus tags are projected to draw with almost 21 points. Early rifle tags are the most popular option for limited entry elk and are projected to draw with an average of just above 17 points, because of the popularity of the early rifle tags I will use that as the benchmark for comparison. Archery tags are projected to draw at about 8 points, so on average you could project to draw an archery tag 9 years before drawing the early rifle tag in a unit. Muzzleloader, middle rifle, and late rifle tags are projected to draw at about 13 points. So you could anticipate drawing any of these tags 4 years before drawing an early rifle tag for the same unit. If you are an archery hunter, your odds of drawing a tag are much higher, and your odds of drawing multiple tags over the course of a couple decades is considerably higher than a rifle hunter applying for an early rifle tag.
For non-residents, although not as dramatic, there is still a "year savings" to be had if you choose to select a more primitive weapon or a later rifle season. Archery projects to save 5 years. Muzzleloader, middle, and late rifle hunts project to save a couple years.
Tag Distribution
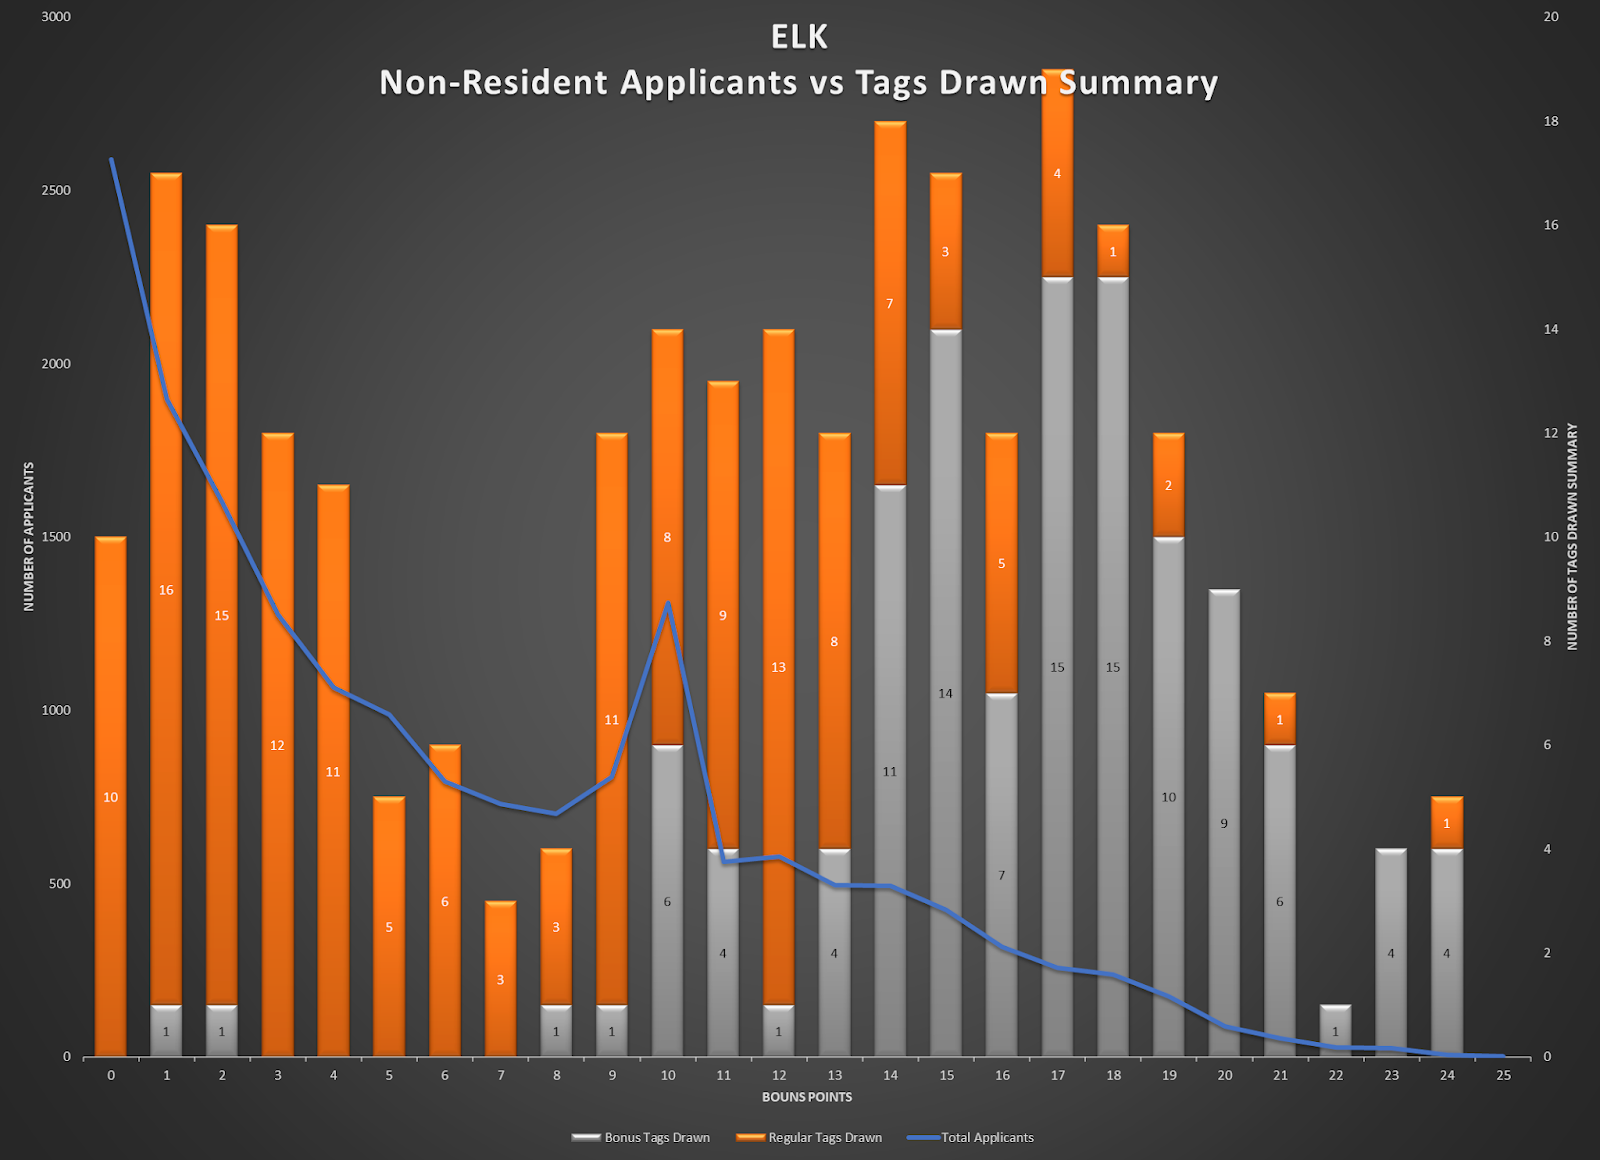
Here is a look at how the tags were distributed in 2019...
The blue line shows the number of applicants and corresponds to the first Y-axis on the left. The orange bars are the regular tags drawn and the gray bars are the bonus tags issued to the highest point holders and correspond to the second second Y-axis on the right.

Pictures


Each point that you accumulate has a value in that it increases your odds of drawing a tag by a certain percentage. That percentage varies depending upon the species, the unit, and even varies from year to year. In the table shown here, you can see that the point value for pronghorn is the highest of any once-in-a-lifetime or limited entry for both residents and non-residents. Pronghorn tag permits does seem to fluctuate more so than the other species because pronghorn do appear to be slightly more susceptible to weather related population swings, gratefully pronghorn also appear to be able to recover quickly from the downswings. For residents, you can expect each bonus point that you have to increase your odds by almost 2%! That means that with 0 points your average odds are 1.904%, with 1 point your average odds are 3.808%... basically take the number of bonus points you have and add 1, then multiply by 2. So if I have 9 points my average odds would be (9+1)*1.904 = 19.04%.
For non-residents the value of a point is 0.189% per bonus point. Follow the same formula to determine your average odds for non-residents take the number of bonus you have and add 1, then multiply by 0.189... so if I had 9 points my average odds would be (9+1)*0.189 = 1.89%.
Applicant Pool Evaluation
Let’s get a feel for the overall applicant pool for pronghorn using the two images below. The first image is shows the resident data, and the second image shows the non-resident data. The orange bars are the number of applicants who submitted an application for a specific hunt unit while the blue bars show the number of applicants who submitted an application to purchase the bonus point, both sets of bars correspond to the y-axis on the left. The gray line indicates the number of random numbers received by applicants who applied for a hunt unit corresponding to the second Y-axis on the right.

In the 2019 application there were more than 2000 new applicants for pronghorn, yet the pronghorn pool remains the smallest applicant pool by a wide margin. It will be interesting to see how the new 5 year waiting period for limited entry deer impacts this applicant pool. The applicant pool for pronghorn follows a smooth exponential curve. Notice that the ratio of actual applicants compared to those who just buy the point is extremely high for pronghorn... it seems that if somebody is applying in the pronghorn pool they are going to apply for a hunt rather than apply for a point. Looking at the number of random numbers issued you can see just how shallow the pronghorn pool is. The number of random numbers issued peaks at the 2 point pool and declines from there.

The non-resident pool for pronghorn was the most dramatically impacted by the change about 10 years ago that allowed non-residents to apply for all limited entry and once-in-a-lifetime species. The number of applicants increased dramatically and has remained much higher than before. I find this interesting because in my opinion Utah is not a destination state for pronghorn, so it seems that non-residents view pronghorn as a cheap add on to the application since they are already buying the hunting license and applying for either deer or elk. My guess would be if the non-resident applicant was forced like the resident applicant to choose between deer, elk, or pronghorn that the pronghorn pool would be significantly smaller than it currently is.
Very quickly here, let's have a quick look at the percentage of applicants that apply for a hunt unit versus the percentage that purchase the point.


These two graphs couldn't look more different. The trend for residents is to apply for an actual hunt unit rather than purchase a point, however the overwhelming trend for the non-resident is to purchase a pronghorn point. For residents it is pretty consistent throughout with about 90% of the applicant pool applying for a hunt unit. Only the top point groups showed a higher percentage of point buyers than actual applicants. The non-resident applicant pool appears to go in the other direction where 40% of most point pools apply for an actual hunt unit. This further solidifies my theory that the non-resident applicant views the pronghorn point as a cheap add on, probably something that will never actually be used because the applicant is likely accumulating pronghorn points to be used following successful deer and elk applications during the waiting period.
Here is a look at the average number of bonus points over the last 5 years that it took to draw a Bonus Tag. I’ve included the PROJECTED 2020 average bonus points:

Pronghorn for residents should be attainable within a decade for a rifle tag and less than 5 years for an archery or muzzleloader tag. For non-residents it will take just over a decade.
Tag Distribution
Here is a look at how the tags were distributed in 2019...
The blue line shows the number of applicants and corresponds to the first Y-axis on the left. The orange bars are the regular tags drawn and the gray bars are the bonus tags issued to the highest point holders and correspond to the second second Y-axis on the right.


Each point that you accumulate has a value in that it increases your odds of drawing a tag by a certain percentage. That percentage varies depending upon the species, the unit, and even varies from year to year. In the table shown here, you can see that the point value for bison has increased, in fact for both residents and non-residents the value of a bison point has doubled over the last 5 years. The wild bison population in Utah has done very well over the last 5 years and the Utah DWR has been able to increase tag numbers and open up additional opportunities. For resident, you can expect each bonus point that you have to increase your odds by about 0.126%, which interestingly enough is the same value as 2007... 12 years ago and is the highest since 2009! That means that with 0 points your average odds are 0.126%, with 1 point your average odds are 0.232%... basically take the number of bonus points you have and add 1, then multiply by 0.126. So if I have 9 points my average odds would be (9+1)*0.126 = 1.26%.
For non-residents the value of a point is significantly less at 0.032% per bonus point, but compare that to the value of the other Once-in-a-Lifetime bonus points and you are getting a ton of value with bison points. Remember, moose was 0.005% per bonus point, desert bighorn was 0.002%, rocky mountain bighorn was 0.003%, and mountain goat was the next highest value at 0.010%. Follow the same formula to determine your average odds for non-residents take the number of bonus you have and add 1, then multiply by 0.032... so if I had 9 points my average odds would be (9+1)*0.032 = 0.320%.
Applicant Pool Evaluation
Let’s get a feel for the overall applicant pool for bison using the two images below. The first image is shows the resident data, and the second image shows the non-resident data. The orange bars are the number of applicants who submitted an application for a specific hunt unit while the blue bars show the number of applicants who submitted an application to purchase the bonus point, both sets of bars correspond to the y-axis on the left. The gray line indicates the number of random numbers received by applicants who applied for a hunt unit corresponding to the second Y-axis on the right.

In the 2019 application there were more than 2200 new applicants for bison. This is a pretty significant number, only moose had more first time applicants and the other once-in-a-lifetime species each had less than 1000 first time applicants. The applicant pool for bison appears to be growing rapidly following an exponential curve. The number of applicants who just bought the point also follows the same smooth exponential curve. Looking at the number of random numbers issued is where the bison pool gets really interesting though. The number of random numbers issues is high and stays high from the 2 point group to the 20 point group. I'm trying to make heads and tails out of this... and I'm torn between saying that the bison bonus points pool is top heavy because there isn't the steep decline in random numbers until after the 20 point group or if all the point pools between 2 and 20 being roughly equal in the number of random numbers issued is an indication of parity among the bonus point pools. I'm still not exactly sure how to interpret this and if that interpretation could be adequately described in words... but suffice it to say that the random number line for bison looks dramatically different than the other once-in-a-lifetime species (the only one that looks even remotely similar is mountain goat).

The non-resident pool appears to match an exponential growth curve although the growth is slightly higher in the point pools below 10, which again corresponds to the year when non-residents were allowed to apply for all once-in-a-lifetime species. Again, my apologies to any applicant who finds themselves in that huge bolus of applicants from the 0 to 10 point pools, the likelihood of you ever being in the system long enough to have reasonable odds of drawing a tag is never.
Very quickly here, let's have a quick look at the percentage of applicants that apply for a hunt unit versus the percentage that purchase the point.


The bison pool bucks the trend of the top point holders having a higher tendency to purchase a preference point rather than apply for a hunt unit for residents. The percentage of applicants who purchase the point only is pretty consistent throughout with between 20 and 30% of the applicants per point pool applying for the point only. Only the top point group showed a higher percentage of point buyers than actual applicants. The non-resident applicant pool appears to go in the other direction where the highest point holders appear to be purchasing points rather than applying for a specific unit. In the top point pools, from 23 to 26, two applicants applied for a unit while nine purchased the point... undoubtedly this will have an impact on "point creep" for the non-resident bison pool.
Here is a look at the average number of bonus points over the last 5 years that it took to draw a Bonus Tag. I’ve included the PROJECTED 2020 average bonus points:

Please take note here, similar to what I described in the previous mountain goat post... there are options available within the bison pool that have the possibility of saving you many years of applying before drawing a bison tag. If you are intent on getting a tag good for a bull then prepare for the long haul however if you are willing to apply for cow only opportunities you can save yourself many years of applications.
Tag Distribution
Here is a look at how the tags were distributed in 2019...
The blue line shows the number of applicants and corresponds to the first Y-axis on the left. The orange bars are the regular tags drawn and the gray bars are the bonus tags issued to the highest point holders and correspond to the second second Y-axis on the right.
 Show me one other once-in-a-lifetime species that issued a bonus tag with less than double digit points... hint... you can't.


My grandfather began applying for a moose permit long before any bonus points were ever offered, and in 2005 he was finally lucky enough to draw the tag. We spent all summer looking at bulls near the family cabin. We found "the bull" on Labor Day weekend early one morning when we went for a drive. I had an archery deer tag at the time so we were halfheartedly looking for deer while inspecting the various bulls that we were seeing that morning. As we came around a bend in the dirt road three moose came into view, two cows and one bull. My dad brought the truck to a stop and as my grandpa inspected further in the binoculars he said, "Ohh, that's a big one... damn, that's a really big one!" With a couple weeks yet until the hunt opened my grandpa kept close tabs on that bull, it didn't stray too far from the area where we spotted him for about a week and a half. Then he just disappeared. The hunt opened and Gramps was a bit frustrated that he hadn't been able to turn up the bull for several days. As he and his long time friend, Gary, drove the 1988 Kawasaki MULE 1000 (the first year that Kawasaki made the MULE) from the cabin up to where the bull had last been spotted another very nice bull was spotted near the road and an easy shot. A debate between the two long time friends ensued and Grandpa decided to take one last look at the bull through the scope. Instincts took over and a couple seconds later the bull was staggering toward the creek bottom. We received a phone call later that morning and Gramps said, "I did a stupid thing, I looked at it through my scope." We rallied the troops and within about 30 minutes 4 grandson's and my dad were in route to help with the dead moose. We helped skin and quarter it, I'm 6'2" and I have pictures of me holding the front hoof above my head while my cousin cut away the front quarter. The size of the animal was intimidating to say the least, but we got it quartered and all the meat and the skull & cape back to the cabin early in the afternoon.
Gramps and Gary were both retired so they had all kinds of time to spare and they stayed up at their cabins (Gramps and Gary had built cabins roughly the same time in this same mountain community) so they continued to go for drives over the next several days just to see if they could turn up that beast of a bull that we had originally spotted on Labor Day weekend. One day, on one of their drives they were passed by a DNR truck. They didn't think much of it until a couple hours later when they again passed the same truck with an enormous bull moose head sticking up out of the back. They flagged down the truck and were able to chat briefly with the DWR employee who had been called to investigate a dead bull moose. It was the bull and it was in fact huge, the DWR officer declined to give them much information other than the bull appeared to have been shot and had been dead for a while. Gramps was both disappointed and relieved at the same time. Although he had high hopes of shooting this impressive bull that now lay in the bed of a DNR truck, from the vague timeline Gramps was able to get he was relieved to have taken the nice bull that he did figuring that the really big bull was already dead by the time the hunt actually opened. I don't know what ever came of any investigation of that incident.
Suffice it to say though that Gramps shot one of the biggest bulls that we have seen since and we compare every bull moose that we see to the bull now hanging on the wall of the cabin.
 Unfortunately, the Utah moose herd has been battling a number of challenges resulting in declining herd numbers. There appears to be a slight glimmer of light at the end of the tunnel though, moose numbers appear to have stabilized a bit and the Moose Management Plan currently allows biologists to take an aggressive approach to their management. After years of not offering antlerless moose permits, there have been a small handful of antlerless tags offered over the last couple years and that is viewed as a positive. Both resident and non-residents face astronomical odds at drawing a moose tag in Utah, like the other once-in-a-lifetime (OIAL) species one should not expect to draw a moose tag with just a few points. Inevitably there will always be the extremely lucky applicants with just a small handful of points, and those lucky few are often met with a mixture of congratulations and hostility from those who have applied for years and years. My grandfather finally drew a moose tag in 2004 with max points at the time after applying annually for more than 30 years.
One item to pay particular attention to in the moose application (and all OIAL applicants) is the number of tags offered. If there has historically only been one tag offered then it is highly likely that only one tag will be offered again this year. When only one tag is offered that tag is through random lottery drawing. This is especially of concern for resident applicants applying for CWMU hunts, the majority of these hunts only offer a single tag so the drawing is a random lottery. If you would like to take full advantage of your bonus points you should really look for units that offer two or more tags. Many applicants are beginning to view these CWMU options as viable alternate choices to the standard public land hunts where drawing a tag may be a lot sooner coming. Again, be aware that most CWMU units only offer a single bull moose permit so no bonus permits are issued and the drawing is performed as a weighted lottery. It is conceivable that an applicant could apply for his or her lifetime and never draw the permit regardless of the number of bonus points that he or she has.
Notice that each of the units in the second table are CWMU units. The drawing odds for these CWMU hunts have all decreased dramatically over the last couple years as many applicants within the moose applicant pool have grown tired of the long waits and the constantly decreasing tag numbers.
For non-residents, there is one unit that offers more than one tag and therefore issued a single guaranteed bonus point tag... Wasatch Mountains. The other units to offer a non-resident moose permits were Ogden, North Slope, Summit and Cache.
Unfortunately, the Utah moose herd has been battling a number of challenges resulting in declining herd numbers. There appears to be a slight glimmer of light at the end of the tunnel though, moose numbers appear to have stabilized a bit and the Moose Management Plan currently allows biologists to take an aggressive approach to their management. After years of not offering antlerless moose permits, there have been a small handful of antlerless tags offered over the last couple years and that is viewed as a positive. Both resident and non-residents face astronomical odds at drawing a moose tag in Utah, like the other once-in-a-lifetime (OIAL) species one should not expect to draw a moose tag with just a few points. Inevitably there will always be the extremely lucky applicants with just a small handful of points, and those lucky few are often met with a mixture of congratulations and hostility from those who have applied for years and years. My grandfather finally drew a moose tag in 2004 with max points at the time after applying annually for more than 30 years.
One item to pay particular attention to in the moose application (and all OIAL applicants) is the number of tags offered. If there has historically only been one tag offered then it is highly likely that only one tag will be offered again this year. When only one tag is offered that tag is through random lottery drawing. This is especially of concern for resident applicants applying for CWMU hunts, the majority of these hunts only offer a single tag so the drawing is a random lottery. If you would like to take full advantage of your bonus points you should really look for units that offer two or more tags. Many applicants are beginning to view these CWMU options as viable alternate choices to the standard public land hunts where drawing a tag may be a lot sooner coming. Again, be aware that most CWMU units only offer a single bull moose permit so no bonus permits are issued and the drawing is performed as a weighted lottery. It is conceivable that an applicant could apply for his or her lifetime and never draw the permit regardless of the number of bonus points that he or she has.
Notice that each of the units in the second table are CWMU units. The drawing odds for these CWMU hunts have all decreased dramatically over the last couple years as many applicants within the moose applicant pool have grown tired of the long waits and the constantly decreasing tag numbers.
For non-residents, there is one unit that offers more than one tag and therefore issued a single guaranteed bonus point tag... Wasatch Mountains. The other units to offer a non-resident moose permits were Ogden, North Slope, Summit and Cache.
 For the Utah resident applicant pool I am noticing a couple things. First, looking at the graph for the actual applicants, I can see that there has been a higher number of applicants in each of the past 3 years than the trend would seem to indicate... especially last year. In the 2019 application there were almost 2500 new applicants for moose! The number of applicants who just bought a point doesn't show nearly as dramatic an increase, but it does appear to be greater than what a trend would indicate. The 17 point group appears to be the peak in regards to the largest amount of random numbers issued.
 For the non-resident pool, the number of applicants has dramatically increased just like the resident pool, and you can see the spike in the 10 point pool from when the State began allowing non-resident applicants to apply for all once-in--lifetime species.
Very quickly here, let's have a quick look at the percentage of applicants that apply for a hunt unit versus the percentage that purchase the point.
For the non-resident pool, the number of applicants has dramatically increased just like the resident pool, and you can see the spike in the 10 point pool from when the State began allowing non-resident applicants to apply for all once-in--lifetime species.
Very quickly here, let's have a quick look at the percentage of applicants that apply for a hunt unit versus the percentage that purchase the point.

 Of note to me in both of these images is that the top point holders have a higher tendency to purchase a preference point rather than apply for a hunt unit. Once-in-a-lifetime applications are an interesting thing… the draw odds are often so long that applicants end up applying anyways. For residents, the percentage of point buyers hovers between 25 and 35 percent for most of the applicant pool. When about 60% of the 24 and 100% of the 25 point holders end up just purchasing a bonus point instead of actually applying for a hunt it makes it very difficult to feel like one could ever catch up to the point creep in the moose pool.
For non-residents the percentage of point buyers appears to be between 30% and 40% pretty much throughout the applicant pool. If I were a non-resident, knowing how minuscule my chances of drawing are, there is no way I would let a year slip by without actively applying for a permit. With only single digit tags to be distributed and more than 8100 active applicants and nearly 6800 point buyers… I’d rather be with the active applicants and at least have a chance at a tag because by buying points annually. I just don’t see how you’re “gaining on it” by buying points year after year so if it were me I'd select a unit and apply rather than buy points... I'll get the point anyway when I get an unsuccessful email.
Here is a look at the average number of bonus points over the last 5 years that it took to draw a Bonus Tag. I’ve included the PROJECTED 2020 average bonus points:
Of note to me in both of these images is that the top point holders have a higher tendency to purchase a preference point rather than apply for a hunt unit. Once-in-a-lifetime applications are an interesting thing… the draw odds are often so long that applicants end up applying anyways. For residents, the percentage of point buyers hovers between 25 and 35 percent for most of the applicant pool. When about 60% of the 24 and 100% of the 25 point holders end up just purchasing a bonus point instead of actually applying for a hunt it makes it very difficult to feel like one could ever catch up to the point creep in the moose pool.
For non-residents the percentage of point buyers appears to be between 30% and 40% pretty much throughout the applicant pool. If I were a non-resident, knowing how minuscule my chances of drawing are, there is no way I would let a year slip by without actively applying for a permit. With only single digit tags to be distributed and more than 8100 active applicants and nearly 6800 point buyers… I’d rather be with the active applicants and at least have a chance at a tag because by buying points annually. I just don’t see how you’re “gaining on it” by buying points year after year so if it were me I'd select a unit and apply rather than buy points... I'll get the point anyway when I get an unsuccessful email.
Here is a look at the average number of bonus points over the last 5 years that it took to draw a Bonus Tag. I’ve included the PROJECTED 2020 average bonus points:


If you have followed this blog for any length of time you have read about my philosophy of "point values." Each point that you accumulate has a value in that it increases your odds of drawing a tag by a certain percentage. That percentage varies depending upon the species, the unit, and even varies from year to year. In the table shown here, you can see that the point value for desert bighorn sheep has declined steadily and due to some population issues. Both desert and rocky mountain bighorn (but more so the rocky mountain bighorn population) have experienced issues with disease and population die offs in different populations affecting the number of tags that can be offered, since the number of tags being offered for desert bighorn is so small that this variation in tag numbers can be seen in the point values from 2016 to 2019. For resident, you can expect each bonus point that you have to increase your odds by about 0.050%. That means that with 0 points your average odds are 0.050%, with 1 point your average odds are 0.100%... basically take the number of bonus points you have and add 1, then multiply by 0.050. So if I have 9 points my average odds would be (9+1)*0.050 = 0.500%.
For non-residents the value of a point is significantly less at 0.002% per bonus point. Follow the same formula to determine your average odds for non-residents take the number of bonus you have and add 1, then multiply by 0.002... so if I had 9 points my average odds would be (9+1)*0.002 = 0.020%.
 In the 2019 application there were almost 950 new applicants for desert bighorn sheep. The applicant pool for desert bighorn appears to be growing rapidly with spikes in applicants in the 0, 1, and 2 point pools. The same goes for the number of applicants who just bought the point, the growth appears to match the trend seen in the applicant pool. The 13 point group appears to be the peak in regards to the largest amount of random numbers issued but there doesn't appear to be as steep a decline and there is a second spike in the 19 point pool which tells me that the desert bighorn bonus point pool is very top heavy with lots of applicants that have very high numbers of bonus points.
 The non-resident pool is interesting... I see a trend and the growth appears to match the trend. If you look at the graph and ignore the bars in the 7 through 10 bonus point pools the number of applicants appears to fall along an exponential growth curve. The outliers in the 7 through 10 bonus point pools coincide with the change allowing non-residents to apply for all once-in-a-lifetime species.
Very quickly here, let's have a quick look at the percentage of applicants that apply for a hunt unit versus the percentage that purchase the point.
The non-resident pool is interesting... I see a trend and the growth appears to match the trend. If you look at the graph and ignore the bars in the 7 through 10 bonus point pools the number of applicants appears to fall along an exponential growth curve. The outliers in the 7 through 10 bonus point pools coincide with the change allowing non-residents to apply for all once-in-a-lifetime species.
Very quickly here, let's have a quick look at the percentage of applicants that apply for a hunt unit versus the percentage that purchase the point.

 In my analysis of moose and mountain goat I noted that there is a trend for the top point holders having a higher tendency to purchase a preference point rather than apply for a hunt unit. The desert bighorn pool of applicants only partially follows this trend. Half of the residents with max points (24) apply for a specific hunt unit while half purchase the bonus point, in lower point pools the great majority of applicants apply for specific units rather than purchase points. The non-resident applicant pool appears does not appear to follow the same trend and the vast majority of applicants apply for specific units.
Once-in-a-lifetime applications are an interesting thing... the draw odds are often so long that applicants should apply for a specific unit regardless... especially non-residents.
Here is a look at the average number of bonus points over the last 5 years that it took to draw a Bonus Tag. I’ve included the PROJECTED 2020 average bonus points:
In my analysis of moose and mountain goat I noted that there is a trend for the top point holders having a higher tendency to purchase a preference point rather than apply for a hunt unit. The desert bighorn pool of applicants only partially follows this trend. Half of the residents with max points (24) apply for a specific hunt unit while half purchase the bonus point, in lower point pools the great majority of applicants apply for specific units rather than purchase points. The non-resident applicant pool appears does not appear to follow the same trend and the vast majority of applicants apply for specific units.
Once-in-a-lifetime applications are an interesting thing... the draw odds are often so long that applicants should apply for a specific unit regardless... especially non-residents.
Here is a look at the average number of bonus points over the last 5 years that it took to draw a Bonus Tag. I’ve included the PROJECTED 2020 average bonus points:


If you have followed this blog for any length of time you have read about my philosophy of "point values." Each point that you accumulate has a value in that it increases your odds of drawing a tag by a certain percentage. That percentage varies depending upon the species, the unit, and even varies from year to year. In the table shown here, you can see that the point value for rocky mountain bighorn sheep has declined steadily and due to some population issues. Both desert and rocky mountain bighorn (but more so the rocky mountain bighorn population) have experienced issues with disease and population die offs in different populations affecting the number of tags that can be offered, since the number of tags being offered for desert bighorn is so small that this variation in tag numbers can be seen in the point values from 2016 to 2019. For resident, you can expect each bonus point that you have to increase your odds by about 0.060% which is a slight increase taking us back to a point value similar to what was seen around 2014 or 2015. That means that with 0 points your average odds are 0.060%, with 1 point your average odds are 0.120%... basically take the number of bonus points you have and add 1, then multiply by 0.050. So if I have 9 points my average odds would be (9+1)*0.060 = 0.600%.
For non-residents the value of a point is significantly less at 0.003% per bonus point. Follow the same formula to determine your average odds for non-residents take the number of bonus you have and add 1, then multiply by 0.003... so if I had 9 points my average odds would be (9+1)*0.003 = 0.030%.
If you really want to be sick... it would take 21 bonus points for a non-resident to have equivalent value to one single bonus point for a Utah resident. Sadly, several years ago when non-residents were permitted to apply for all once-in-a-lifetime species instead of selecting one like residents are required to do the non-resident bonus point was greatly de-valued.
Applicant Pool Evaluation
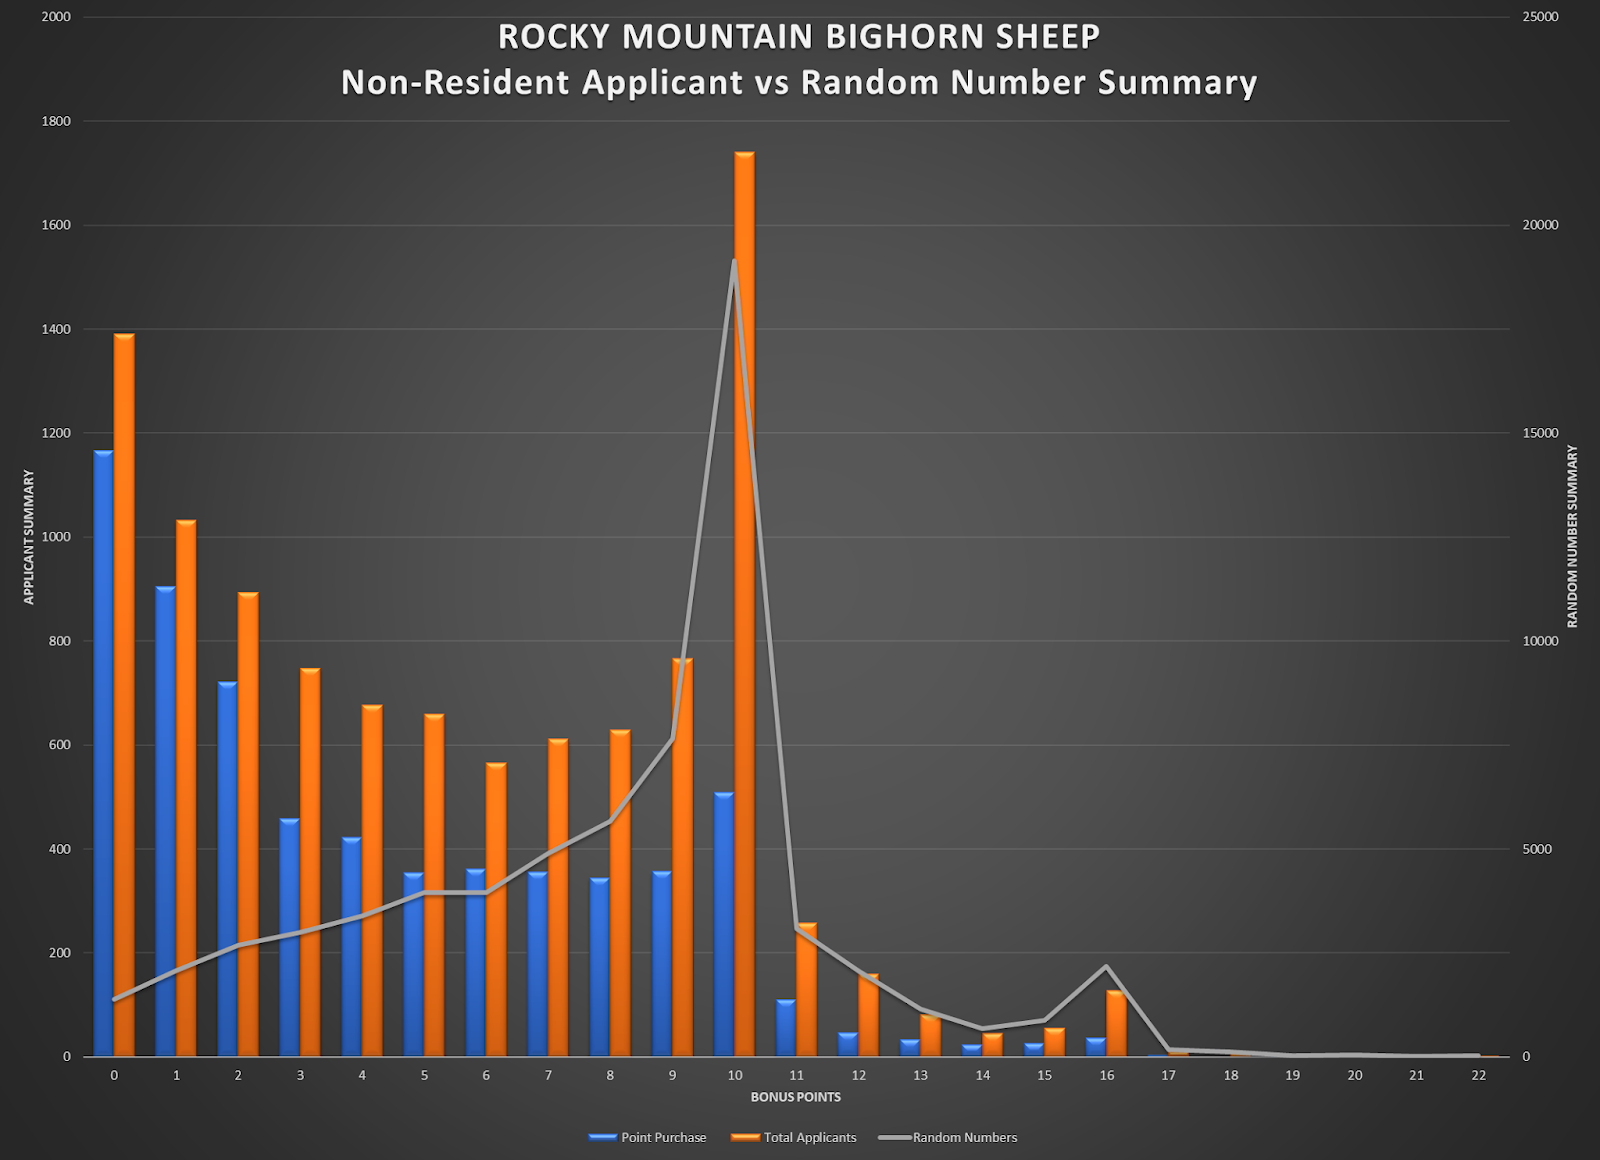
Let’s get a feel for the overall applicant pool for rocky mountain bighorn sheep using the two images below. The first image is shows the resident data, and the second image shows the non-resident data. The orange bars are the number of applicants who submitted an application for a specific hunt unit while the blue bars show the number of applicants who submitted an application to purchase the bonus point corresponding to the y-axis on the left. The gray line indicates the number of applicants who applied for a hunt unit corresponding to the second Y-axis on the right.
 In the 2019 application there were more than 800 new applicants for rocky mountain bighorn sheep. The applicant pool for rocky mountain bighorn appears to be growing rapidly with an odd spike in applicants in the 2 point pools, a slight decline in 1 point applicants, but then a big bump in 0 point applicants. The number of applicants who just bought the point doesn't appear to have the same dramatic bump in the 2 point pool and decrease in 1 point pool... looking a the trend on the graph the number of people that buy points appears to be pretty steady. The 11 point group appears to be the peak in regards to the largest amount of random numbers issued but there doesn't appear to be a steep decline until the 17 point group, this tells me that the rocky mountain bighorn bonus point pool is top heavy with lots of applicants that have very high numbers of bonus points.
 The non-resident pool is interesting... I see a trend and the growth appears to match an exponential growth curve. If you look at the graph and ignore the bars in the 7 through 10 bonus point pools the number of applicants appears to be quite steady. The outliers in the 7 through 10 bonus point pools coincide with the change allowing non-residents to apply for all once-in-a-lifetime species. Then there's that bizarre little spike in the 16 point group, I can't really attribute that to any one thing and it's weird to me.
Very quickly here, let's have a quick look at the percentage of applicants that apply for a hunt unit versus the percentage that purchase the point.
The non-resident pool is interesting... I see a trend and the growth appears to match an exponential growth curve. If you look at the graph and ignore the bars in the 7 through 10 bonus point pools the number of applicants appears to be quite steady. The outliers in the 7 through 10 bonus point pools coincide with the change allowing non-residents to apply for all once-in-a-lifetime species. Then there's that bizarre little spike in the 16 point group, I can't really attribute that to any one thing and it's weird to me.
Very quickly here, let's have a quick look at the percentage of applicants that apply for a hunt unit versus the percentage that purchase the point.

 Notice that there is a trend for the top point holders having a higher tendency to purchase a preference point rather than apply for a hunt unit for residents. Five of the seven applicants with 23 or more bonus points did not actually apply for a hunt rather they purchased bonus points instead. This certainly will impact the "point creep" within the rocky mountain bighorn applicant pool as these 5 point buyers eventually decide to burn their points on an actual hunt. The non-resident applicant pool does not appear to follow the same trend to the same extent and the vast majority of applicants apply for specific units. But, since no bonus points are issued (no unit offers more than 1 tag) there is currently no appreciable benefit in purchasing a point rather applying for a unit... at least until the rocky mountain bighorn population is such that enough tags are offered to non-residents that having the highest number of bonus points is beneficial. If I was a non-resident, I would be applying for a unit rather than purchasing a point every single year.
Here is a look at the average number of bonus points over the last 5 years that it took to draw a Bonus Tag. I’ve included the PROJECTED 2020 average bonus points:
Notice that there is a trend for the top point holders having a higher tendency to purchase a preference point rather than apply for a hunt unit for residents. Five of the seven applicants with 23 or more bonus points did not actually apply for a hunt rather they purchased bonus points instead. This certainly will impact the "point creep" within the rocky mountain bighorn applicant pool as these 5 point buyers eventually decide to burn their points on an actual hunt. The non-resident applicant pool does not appear to follow the same trend to the same extent and the vast majority of applicants apply for specific units. But, since no bonus points are issued (no unit offers more than 1 tag) there is currently no appreciable benefit in purchasing a point rather applying for a unit... at least until the rocky mountain bighorn population is such that enough tags are offered to non-residents that having the highest number of bonus points is beneficial. If I was a non-resident, I would be applying for a unit rather than purchasing a point every single year.
Here is a look at the average number of bonus points over the last 5 years that it took to draw a Bonus Tag. I’ve included the PROJECTED 2020 average bonus points:
 Tag Distribution
Here is a look at how the tags were distributed in 2019...
The blue line shows the number of applicants and corresponds to the first Y-axis on the left. The orange bars are the regular tags drawn and the gray bars are the bonus tags issued to the highest point holders and correspond to the second second Y-axis on the right.
Tag Distribution
Here is a look at how the tags were distributed in 2019...
The blue line shows the number of applicants and corresponds to the first Y-axis on the left. The orange bars are the regular tags drawn and the gray bars are the bonus tags issued to the highest point holders and correspond to the second second Y-axis on the right.


If you have followed this blog for any length of time you have read about my philosophy of "point values." Each point that you accumulate has a value in that it increases your odds of drawing a tag by a certain percentage. That percentage varies depending upon the species, the unit, and even varies from year to year. In the table shown here, you can see that the peak of the mountain goat point value was back in 2012 for residents. Unfortunately, the value of a point for non-residents has decreased annually. For resident, you can expect each bonus point that you have to increase your odds by about 0.123%. That means that with 0 points your average odds are 0.123%, with 1 point your average odds are 0.246%... basically take the number of bonus points you have and add 1, then multiply by 0.123. So if I have 9 points my average odds would be (9+1)*0.123 = 1.23%.
For non-residents the value of a point is significantly less at 0.010% per bonus point. Follow the same formula to determine your average odds for non-residents take the number of bonus you have and add 1, then multiply by 0.010... so if I had 9 points my average odds would be (9+1)*0.010 = 0.100%.
Unfortunately, the mountain goat population is highly fluctuating right now and many of the core populations are being used to establish populations elsewhere in the state and therefore opportunity and the number of tags offered from year to year can fluctuate. Both resident and non-residents face astronomical odds at drawing a mountain goat tag in Utah, but unlike bull moose and the two bighorn species there may be some hope that one of these tags could be drawn in a lifetime.
One item to pay particular attention to in the mountain goat application (and all OIAL applicants) is the number of tags offered. If there has historically only been one tag offered then it is highly likely that only one tag will be offered again this year. When only one tag is offered that tag is through random lottery drawing. If you would like to take full advantage of your bonus points you should really look for units that offer two or more tags.
A second item to pay attention to in relation to the mountain goat application is that there may be a handful of nanny only options where the highest point holders have much lower point totals. These opportunities are generally tied to the larger goat populations that can be used in re-population or population establishment, so the number of tags can be high one year and very low the next so there is some risk in selecting the nanny only options.
Recently there have also been archery only options. I don't have a whole lot of information on these hunts since they have been around for only a short amount of time, but the bonus tags do appear to draw at a lower level than any weapon tags.
 In the 2019 application there were almost 1000 new applicants for mountain goat, that number still pales in comparison to the 2500 new moose applicants! The applicant pool for mountain goat appears to be growing steadily, there appears to be a spike in applicants in the 2 point pool but last year and this year the growth in applicants in the 1 and 0 point pools appears to be right in line with trends. The same goes for the number of applicants who just bought the point, the growth appears to match the trend. The 12 point group appears to be the peak in regards to the largest amount of random numbers issued... remember that for moose the peak for random numbers was 17 so the applicant pool for mountain goat is significantly smaller and is far less top heavy in regards to the number of applicants with very high numbers of points.
 For the non-resident pool, growth appears to mimic the resident pool, with the exception of the 10 point pool from when the State began allowing non-resident applicants to apply for all once-in--lifetime species. If you happen to find yourself above that huge bolus of applicants beginning in the 10 point pool you actually find yourself in a decent spot... if you are behind that 10 point spike and the larger number of applicants in the point pools below 10 I would say you are fighting what would ultimately be a losing battle.
Very quickly here, let's have a quick look at the percentage of applicants that apply for a hunt unit versus the percentage that purchase the point.
For the non-resident pool, growth appears to mimic the resident pool, with the exception of the 10 point pool from when the State began allowing non-resident applicants to apply for all once-in--lifetime species. If you happen to find yourself above that huge bolus of applicants beginning in the 10 point pool you actually find yourself in a decent spot... if you are behind that 10 point spike and the larger number of applicants in the point pools below 10 I would say you are fighting what would ultimately be a losing battle.
Very quickly here, let's have a quick look at the percentage of applicants that apply for a hunt unit versus the percentage that purchase the point.

 Of note to me in both of these images is that the top point holders have a higher tendency to purchase a preference point rather than apply for a hunt unit. Once-in-a-lifetime applications are an interesting thing... the draw odds are often so long that applicants end up applying anyways. For residents, the percentage of point buyers hovers between 25 and 30 percent for most of the applicant pool. When a majority of the highest point holders end up just purchasing a bonus point instead of actually applying for a hunt it makes it very difficult to feel like one could ever catch up to the point creep in the moose pool.
For non-residents the percentage of point buyers appears to be between 30% and 50% pretty much throughout the applicant pool. If I were a non-resident, knowing how minuscule my chances of drawing are, there is no way I would let a year slip by without actively applying for a permit. With only maybe 10 tags to be distributed and more than 7600 active applicants and nearly 5400 point buyers… I’d rather be with the active applicants and at least have a chance at a tag because by buying points annually. I just don’t see how you’re “gaining on it” by buying points year after year so if it were me I'd select a unit and apply rather than buy points... I'll get the point anyway when I get an unsuccessful email.
Here is a look at the average number of bonus points over the last 5 years that it took to draw a Bonus Tag. I’ve included the PROJECTED 2020 average bonus points:
Of note to me in both of these images is that the top point holders have a higher tendency to purchase a preference point rather than apply for a hunt unit. Once-in-a-lifetime applications are an interesting thing... the draw odds are often so long that applicants end up applying anyways. For residents, the percentage of point buyers hovers between 25 and 30 percent for most of the applicant pool. When a majority of the highest point holders end up just purchasing a bonus point instead of actually applying for a hunt it makes it very difficult to feel like one could ever catch up to the point creep in the moose pool.
For non-residents the percentage of point buyers appears to be between 30% and 50% pretty much throughout the applicant pool. If I were a non-resident, knowing how minuscule my chances of drawing are, there is no way I would let a year slip by without actively applying for a permit. With only maybe 10 tags to be distributed and more than 7600 active applicants and nearly 5400 point buyers… I’d rather be with the active applicants and at least have a chance at a tag because by buying points annually. I just don’t see how you’re “gaining on it” by buying points year after year so if it were me I'd select a unit and apply rather than buy points... I'll get the point anyway when I get an unsuccessful email.
Here is a look at the average number of bonus points over the last 5 years that it took to draw a Bonus Tag. I’ve included the PROJECTED 2020 average bonus points:


.jpg)